While it's impossible to predict the future when it comes to financial markets, it's usually possible to identify the events that have higher potential to cause bigger swings. Other times, volatility strikes on days when it wasn't entirely expected.
That's how this past week began. After Monday's holiday closure, rates jumped higher on Tuesday morning without warning. What would a "warning" have looked like? It could be as simple as the presence of a scheduled economic report with a history of causing a volatile market response. Tuesday had none of those, but it did have a legitimate market mover pulling the strings behind the scenes.
The puppet master in question is a bit esoteric without a quick refresher:
- Interest rates are based on bonds.
- The Fed sets a target for the shortest-term bonds, but the market trades it out from there.
- There are all kinds of bonds. US Treasuries are government bonds. Mortgage backed securities (MBS) are bonds tied to mortgage cash flows. Municipal bonds finance local government operations. Corporate bonds finance various spending/investment needs for large companies.
- All these bonds are slightly different in their risk and reward, but they are all part of the same asset class in the eyes of investors. Specifically, bonds are a "fixed income" investment that allow investors to receive a fixed schedule of repayment with interest.
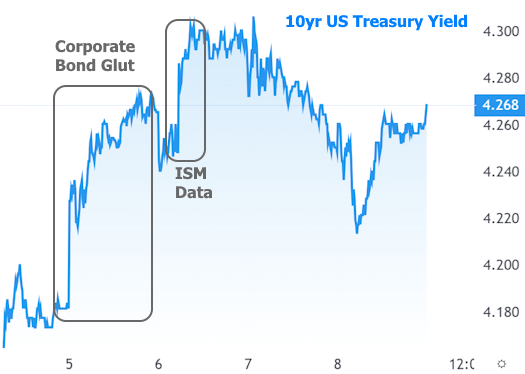
With all that out of the way, the following will hopefully make more sense. Tuesday was the 5th biggest day ever for new corporate bonds being offered for sale. The top 4 days all benefited from extremely large individual bonds from one company. All 4 had at least one offering of $25 billion or more. That made Tuesday all the more notable in that the largest bond was "only" $4.75 billion.
In other words, there was a deluge of new bonds competing for investors' attention. That means relatively lower demand for other bonds such as MBS. When demand for a bond falls, it results in lower prices, and lower prices mean higher rates.
The market knew that this week would be a healthy one for new corporate bonds, but reality exceeded expectations. The bottom line is that the excess supply caused a bit of weakness across the entire bond market, including the part that dictates mortgage rates.
We also had some good, old-fashioned economic data hit the market on Wednesday, but it didn't do us any favors either. The ISM Non-Manufacturing Index showed the services sector growing more than expected in August. This includes a separate index that showed higher prices as well. In addition to rising more than expected, both indices give the impression they're in the process of bouncing after correcting from the "too hot" levels in early 2022.
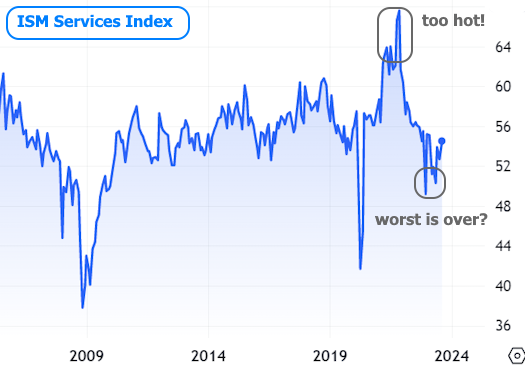

Stronger economic data and higher prices are two of the biggest enemies of rates. It made Wednesday the worst day of the week for the average mortgage lender. 10yr Treasury yields provide a benchmark for interest rate movement this week and allow us to see more granular detail.
Things calmed down heading into the weekend with rates staying safely below the highs seen at the end of August, but that wasn't much of a consolation in the bigger picture.

The week ahead brings some high stakes economic data in the form of August's Consumer Price Index (CPI). This broad inflation metric has been one of the most important sources of influence for the market on any given month over the past few years and this one could be one of the more notable examples.
CPI has been falling in general, but the decline runs the risk of being misleading due to the broad decline in fuel prices that ended 2 months ago. Last month's data began to show the effects of that fuel price reversal and some analysts think it will be more apparent in next week's report. This has resulted in a wider range of forecasts than normal and that tends to result in a more volatile market response.
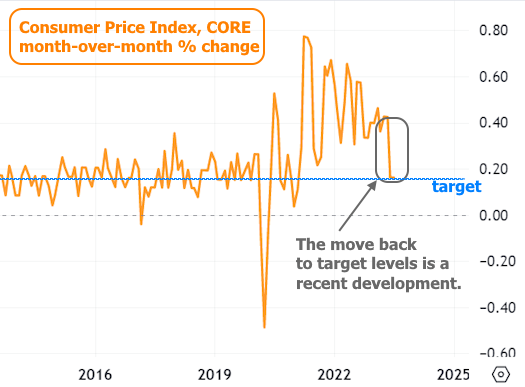
Note the small bounce in "headline" inflation, which includes fuel prices versus "core" inflation which excludes fuel. Like with the ISM data above, some market watchers think the economy has merely corrected from overly hot conditions and that growth/inflation could continue to be more resilient than expected.

To make matters more consequential, it is the "blackout week" for the Fed where members refrain from commenting on monetary policy in the 12 days leading up to a rate announcement. That means the market's imagination can run a bit wilder than normal when it comes to interpreting the CPI results.
At the end of the day, everyone is trying to get to the same answer: is inflation truly defeated or does policy need to stay tighter to keep inflation from bouncing. The following chart of monthly core inflation shows that we've only recently returned to target levels. The market keeps waiting for the Fed to say that the return is sustainable and the Fed keeps saying "we're not sure yet."