Mortgage rates have been volatile in 2022. Most of that volatility has played out in the form of higher rates. The past 2 weeks have been a notable exception.
To understand why this is happening, we first need to consider that higher inflation means higher rates. It was easy to forget that for most of the past decade, but impossible to escape since early 2021, and especially since early 2022.
Several big jumps in inflation have forced the Federal Reserve to drastically tighten policy. One of those policies had been to buy lots of bonds, including those that specifically underlie the mortgage market. More bond buying demand = lower rates. As the Fed backs out, rates are hit with the double whammy of high inflation and less buying demand.
The resulting surge had covered enough ground by early May that it was time to consider the possibility that they'd topped out indefinitely. That may have proven to be the case were in not for a duo of hotter-than-expected inflation reports in the EU and US. The latter (the Consumer Price Index or CPI) was particularly troubling. It happened on June 10th and was responsible for the rapid spike up in 30yr fixed rates up into the 6's.
Fast forward 3 weeks and rates are just now back to the levels seen on June 10th. The following chart includes the often-cited, but frequently misleading weekly rate survey from Freddie Mac in addition to actual daily averages for top tier 30yr fixed rate quotes. Volatility!
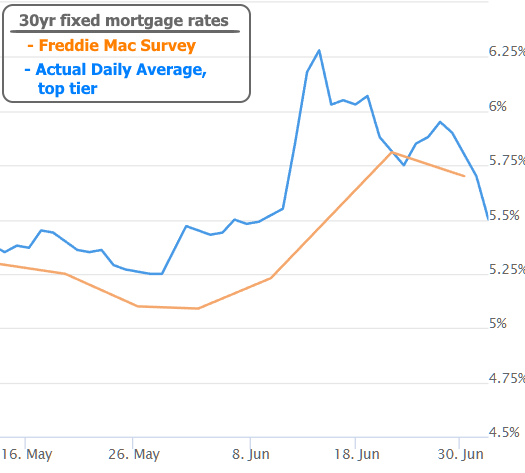
So why have rates dropped so much in the past few weeks?
First off, they probably rose a bit too aggressively in mid-June. Traders were nervous as they waited to see how the Fed would respond to the June 10th CPI report (the Fed announcement was June 15th). After that, it's possibly as simple as saying a majority of the economic data at home and abroad sent the signals we were hoping to see before last month's inflation surprise.
This week's most hotly anticipated example was the PCE inflation data, which, along with CPI is one of the 2 major inflation indices in the US. Although it was only slightly cooler than expected, this is all the market needed to continue the healing process. PCE also showed the 3rd consecutive month of declines.

The notion of a "healing" process for rates is bittersweet as it draws strength from damage to the global economy. One of the most basic ways to follow general economic trends is via PMI (Purchasing Managers Index) data. These are typically divided into manufacturing and non-manufacturing flavors. They're far more timely than GDP data, so markets are more willing to respond.
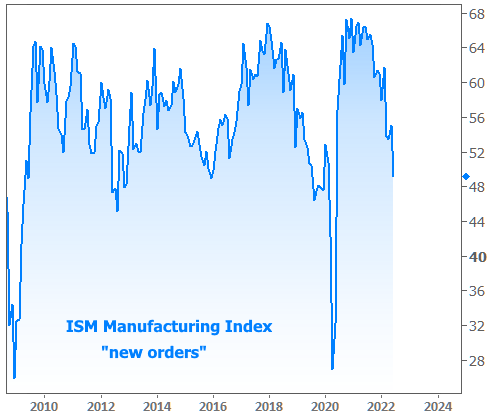
Most of the PMI data in Europe and US has been slipping recently with some notable milestones. One of the components of the Eurozone report showed the first decline in manufacturing output in more than 2 years. The US version painted a similar picture via the contraction in "new orders" which plunged well into 2-year lows, matching the weakest pre-pandemic levels going back to the financial crisis.
The combination of weaker economic data, cooler inflation, and an apparently overdone rate spike back in June mean it's once again time to entertain that we've seen the top in rates for 2022. NOTE: this only refers to a ceiling. We wouldn't expect rates to be able to plummet until several months of data confirm a return to historically normal levels of inflation.
As for a ceiling, the bond market is certainly considering it. In fact, it's actively making that bet. The following chart shows market-based inflation expectations (in orange). As of this week, they fell back to mid-2021 lows.

Keep in mind, mid-2021 lows are still higher than anything seen since 2014. Also consider that the orange line represents expectations for the next 10 years... not a forecast for imminent price movement (any positive number means that prices would still be increasing, just not as quickly).
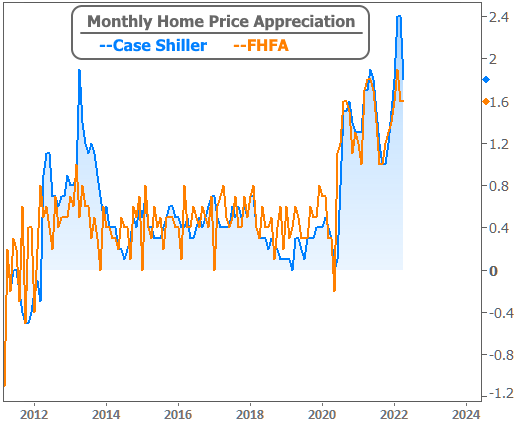
Nowhere is that concept more painfully apparent than in home prices. This week's home price data from both FHFA and Case Shiller showed price growth remaining near 20% year-over-year.

There are two caveats here. The first is that the month-over-month numbers will be increasingly important as economists look for a turning point in prices. No love there:
The second is that home price indices are notoriously late. Both were released this past Tuesday, June 28th, and they cover the month of April. Lots has happened since then! Some of the drama has been captured in the form of "price cuts" on real estate listings.
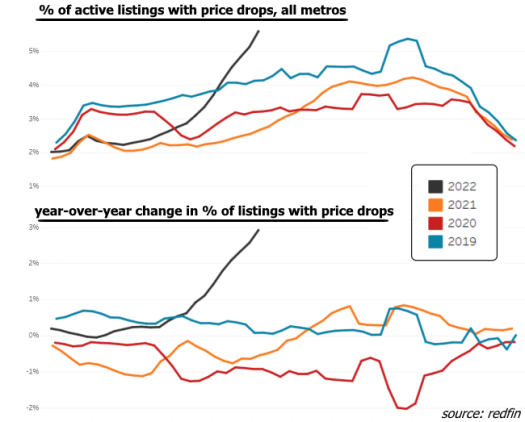
As we discussed last week, this is best viewed as a shift back in the direction of sanity. A majority of the price cuts are among sellers who were getting greedy based on the staggering price trajectory of the past 2 years. Price cuts among that cohort are not only good, they're necessary! We want house price growth to be slow, steady, and sustainable. That will require a sharp contraction in price growth with some areas seeing modest contractions, all followed by a period of very low growth.
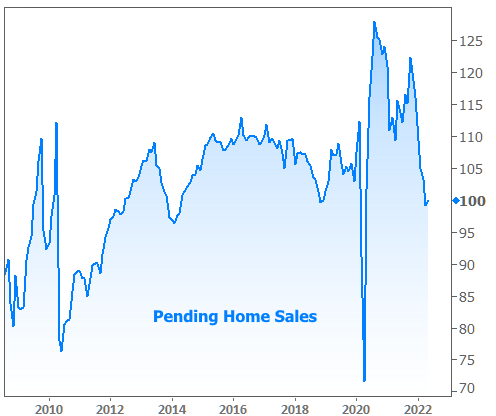
All of that might sound scary for those who remember 2007-2009, but we're not talking about big, widespread price declines--just enough of a return to normalcy to arrest the slide seen in home sales.