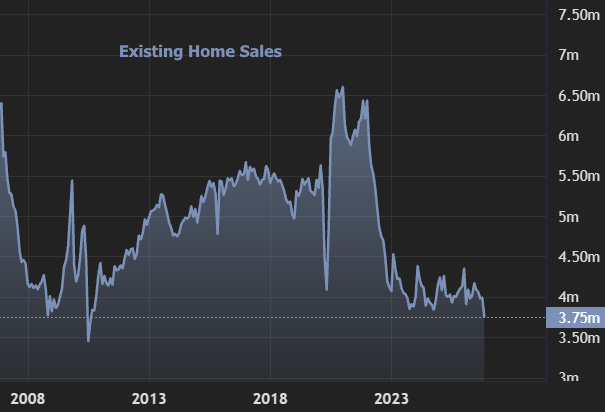
Existing-home sales had another rough month, and just hit their lowest level since August 2010. Mortgage rates are largely to blame.
The National Association of REALTORS® (NAR) reported a 5.5% monthly decline and an 8.8% year-over-year decline, bringing the seasonally adjusted annual sales rate to just 3.75 million. Chief Economist Lawrence Yun attributed the weakness to mortgage rates, which have tested levels not seen since 2000.
Inventory continued to improve modestly, even as sales slowed. Total housing inventory reached 1.59 million units, up 1.3% from September and 4.6% year over year, a 5.1-month supply. Homes also took slightly longer to sell, with the median time on market increasing to 35 days from 33 days in September.
Prices continued to rise nationally, although at a much slower pace. Median prices crawled to $416,700, up a mere 0.4% from October 2025. Still, that marked the 40th consecutive month of year-over-year price gains. The Housing Affordability Index fell to 100.7, down from 107.3 a year earlier, with affordability deteriorating across the country.
Regional Breakdown (Sales and Prices, October 2026)
| Region | Sales (annual rate) | MoM Change | Median Price | YoY Change |
|---|---|---|---|---|
| Northeast | 470k | 0.0% | $519,600 | +3.2% |
| Midwest | 900k | -3.2% | $324,300 | +1.5% |
| South | 1.73m | -6.5% | $360,900 | -0.4% |
| West | 650k | -9.7% | $624,300 | 0.0% |
National Market Stats
- Total Housing Inventory: 1.59 million units (up 1.3% from September; up 4.6% YoY)
- Unsold Inventory Supply: 5.1 months (up from 4.7 months in September and 4.4 months a year ago)
- Median Existing-Home Price: $416,700 (up 0.4% YoY; 40th consecutive annual increase)
- Housing Affordability Index: 100.7 (down from 107.3 one year ago)
- Single-Family Sales: 3.41 million (down 5.8% MoM; down 8.6% YoY)
- Single-Family Median Price: $421,900 (up 0.4% YoY)
- Condo/Co-op Sales: 340k (down 2.9% MoM; down 10.5% YoY)
- Condo/Co-op Median Price: $365,100 (up 0.3% YoY)