
The National Association of Realtors today released Existing Home Sales data for March 2011
Existing Home Sales report on the number of completed real estate sales transactions on single-family homes, townhomes, condominiums and co-ops. The methodology in calculating existing-home sales statistics is really quite simple. Each month the National Association of Realtor® receives data on existing-home sales from local associations/boards and multiple listing services (MLS) nationwide. The monthly EHS economic indicator is based on a representative sample of 160 Boards/MLSs. NAR captures 30-40% of all existing-home sale transactions with its monthly survey.
HERE is the methodology for the data collection
Reuters Quick Recap...
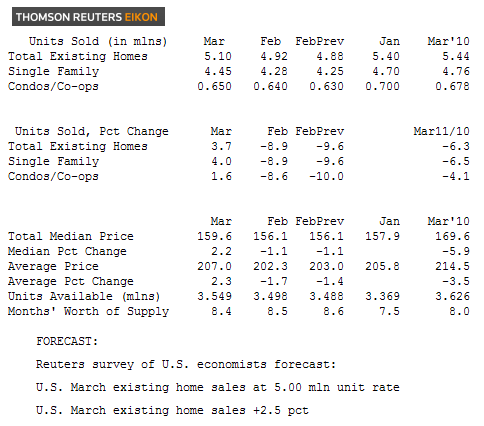
RTRS - US MARCH EXISTING HOME SALES 5.10 MLN UNIT ANNUAL RATE (CONS 5.00 MLN) VS FEB 4.92 MLN (PRV 4.88 MLN)-NAR
RTRS - US MARCH EXISTING HOME SALES +3.7 PCT (CONS +2.5 PCT) VS FEB -8.9 PCT (PREV -9.6 PCT)-NAR
RTRS - US MARCH INVENTORY OF HOMES FOR SALE +1.5 PCT TO 3.549 MLN UNITS, 8.4 MONTHS' SUPPLY-NAR
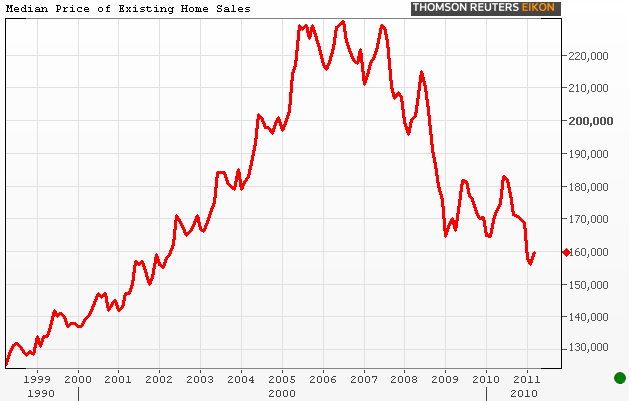
RTRS - US MARCH NATIONAL MEDIAN PRICE FOR EXISTING HOMES $159,600, -5.9 PCT FROM MARCH 2010-NAR
RTRS - US NAR SAYS 40 PCT OF U.S. MARCH EXISTING HOME SALES WERE DISTRESSED SALES, HIGHEST SINCE APRIL 2009 (45 PCT), VERSUS 39 PCT IN FEB
Excerpts from the Release...
Sales of existing-home sales rose in March, continuing an uneven recovery that began after sales bottomed last July, according to the National Association of Realtors®.
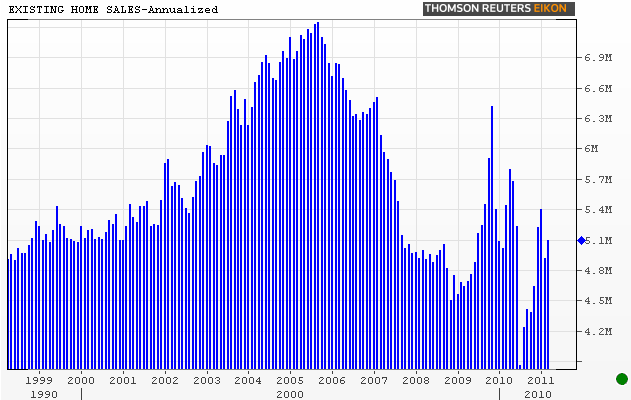
Total existing-home sales, which are completed transactions that include single-family, townhomes, condominiums and co-ops, increased 3.7 percent to a seasonally adjusted annual rate of 5.10 million in March from an upwardly revised 4.92 million in February, but are 6.3 percent below the 5.44 million pace in March 2010.
Sales were at elevated levels from March through June of 2010 in response to the home buyer tax credit. A parallel NAR practitioner survey shows first-time buyers purchased 33 percent of homes in March, compared with 34 percent of homes in February; they were 44 percent in March 2010.
Single-family home sales rose 4.0 percent to a seasonally adjusted annual rate of 4.45 million in March from 4.28 million in February, but are 6.5 percent below the 4.76 million level in March 2010. Existing condominium and co-op sales increased 1.6 percent to a seasonally adjusted annual rate of 650,000 in March from 640,000 in February, but are 4.1 percent below the 678,000-unit pace one year ago.
Regionally, existing-home sales in the Northeast rose 3.9 percent to an annual level of 800,000 in March but are 12.1 percent below March 2010. Existing-home sales in the Midwest increased 1.0 percent in March to a pace of 1.06 million but are 13.1 percent lower than a year ago. In the South, existing-home sales rose 8.2 percent to an annual level of 1.99 million in March but are 1.0 percent below March 2010. Existing-home sales in the West slipped 0.8 percent to an annual pace of 1.25 million in March and are 3.1 percent below a year ago.
All-cash sales were at a record market share of 35 percent in March, up from 33 percent in February; they were 27 percent in March 2010. Investors accounted for 22 percent of sales activity in March, up from 19 percent in February; they were 19 percent in March 2010. The balance of sales were to repeat buyers.
Distressed homes – typically sold at discounts in the vicinity of 20
percent – accounted for a 40 percent market share in March, up from 39
percent in February and 35 percent in March 2010. This pressured home prices lower....
The national median existing-home price for all housing types was $159,600 in March, down 5.9 percent from March 2010. The median existing single-family home price was $160,500 in March, down 5.3 percent from a year ago. The median existing condo price was $153,100 in March, which is 10.1 percent below March 2010.
NAR’s housing affordability index shows the typical monthly mortgage principal and interest payment for the purchase of a median-priced existing home is only 13 percent of gross household income, the lowest since records began in 1970.
Regionally the median price in the Northeast was $232,900, down 3.0 percent from a year ago. The median price in the Midwest was $126,100, which is 7.1 percent below March 2010. The median price in the South was $138,200, down 6.6 percent from a year ago. The median price in the West was $192,100, which is 11.2 percent lower than March 2010.
Total housing inventory at the end of March rose 1.5 percent to 3.55 million existing homes available for sale, which represents an 8.4-month supply at the current sales pace, compared with a 8.5-month supply in February.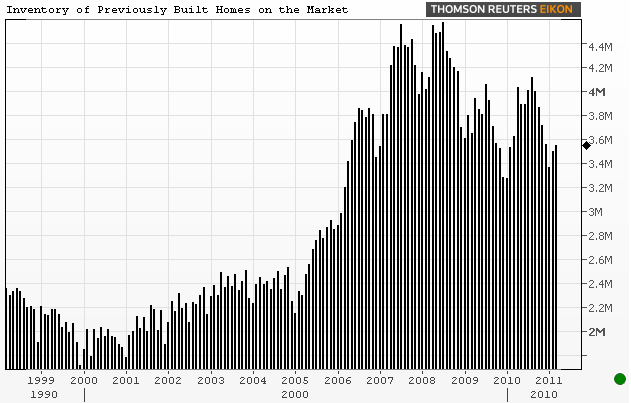
Lawrence Yun, NAR chief economist, expects the improving sales pattern to continue. “Existing-home sales have risen in six of the past eight months, so we’re clearly on a recovery path,” he said. “With rising jobs and excellent affordability conditions, we project moderate improvements into 2012, but not every month will show a gain – primarily because some buyers are finding it too difficult to obtain a mortgage. For those fortunate enough to qualify for financing, monthly mortgage payments as a percent of income have been at record lows.”
Data from Freddie Mac and Fannie Mae show requirements to obtain conventional mortgages have been tightened, with the average credit score rising to about 760 in the current market from nearly 720 in 2007; for FHA loans the average credit score is around 700, up from just over 630 in 2007.
“Although home sales are coming back without a federal stimulus, sales would be notably stronger if mortgage lending would return to the normal, safe standards that were in place a decade ago – before the loose lending practices that created the unprecedented boom and bust cycle,” Yun explained.
Plain and Simple: Existing Home Sales were better than expected and improved from February. 40% of sales were distressed inventory though and home prices fell 5.9% year over year. Realtors continue to blame tight underwriting regs for unsustainable positive progress in the housing market....as evidenced by this statistic: All-cash sales were at a record market share of 35 percent in March.
SAME STORY AS LAST MONTH: Tight Credit Limits Home Buyer Demand. Cash is King


