MBSonMND: MBS MID-DAY
| Open MBSonMND Dashboard | ||||||||||||||
|
|
|
||||||||||||
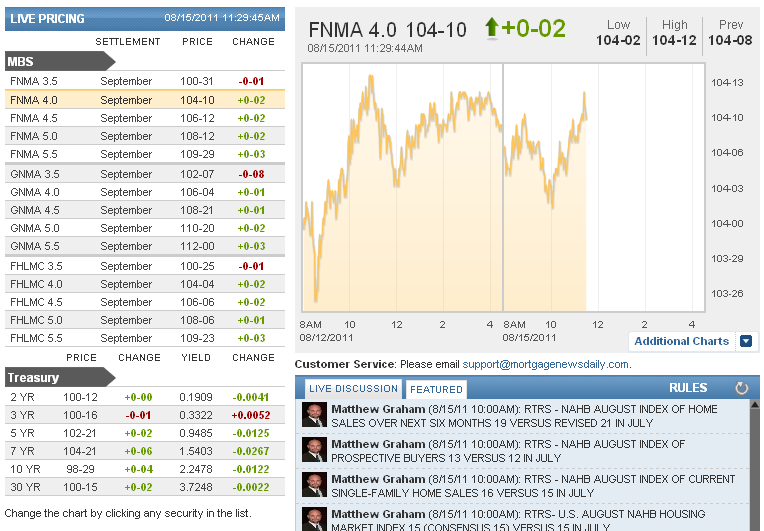
| Pricing as of 11:01 AM EST | ||||||||||||||
Morning Market Updates
A recap of MBS Market Updates provided by MND Analysts and streamed live to the MBSonMND Dashboard
.
10:02AM :
ECON: Homebuilder Sentiment Stagnant in August
(Reuters) - U.S. homebuilder sentiment remained stuck at historic lows in August, as a glut of distressed homes, tight credit, and economic uncertainty kept new buyers out of the market, the National Association of Home Builders said on Monday.
The NAHB/Wells Fargo Housing Market index remained at 15 in August, the group said in a statement, on target with economists' expectations.
Readings below 50 mean more builders view market conditions as poor than favorable.
The index has hovered at historic lows between 14 and 22 since the start of 2008, after it never went below 19 between 1985 and October 2007.
"While buying conditions are very favorable in terms of prices, interest rates and selection, consumers are worried about what the future will bring, and builders are echoing those sentiments in their responses to the HMI survey," said NAHB Chief Economist David Crowe.
A large inventory of distressed homes, inaccurate appraisal values, and tight lending standards continue to depress new home demand, Bob Nielsen, chairman of NAHB, said.
Forty-one percent of respondents said they had lost sales contracts because of buyers' inability to sell their current homes.
(Reporting by Alexandra Alper; Editing by Padraic Cassidy)
9:49AM :
ALERT:
MBS Fall to New Lows on the Day After Stocks Open Higher
Although there is another piece of economic data coming up at 10am (Housing Market Index), it's not usually a big market mover. The lack of response to earlier data supports the notion that bond markets continue to pay attention to stock markets. With that in mind, Treasuries and MBS are at their weakest levels of the morning after stocks opened higher and with the S&P currently trading above a 1188 pivot point (at 1193.29 currently). Fannie 4.0's are down an eighth of a point from last check at 104-04. 10's are at 2.267, not even 1 bp worse on the day. In other words, the losses are moderate, no major cause for concern although rate sheets could be delayed and there's an outside chance of "reprice for the worse" risk for rate sheets that were already out.
9:38AM :
ECON: China Increases TSY Holdings, Overall Foreign Holdings Decrease
(Reuters) - Foreigners were net sellers of all U.S. assets in June for a second straight month and bought the fewest long-term securities in more than two years, data from the U.S. Treasury Department showed on Monday.
Foreigners were also net sellers of Treasury debt for the first time since May 2009, as heavy selling from private investors outweighed buying from central banks, data showed.
Treasuries suffered a net outflow of $4.5 billion, the first since May 2009, but China, the largest foreign U.S. creditor, increased Treasury holdings by $5.7 billion to $1.166 trillion.
Including short-dated assets such as bills, the United States suffered a net outflow of $29.5 billion, though that was an improvement over the prior month's downwardly revised outflow of $48.8 billion.
Net purchases of long-term securities fell to $3.7 billion from a revised $24.2 billion in May. The June tally was the lowest since May of 2009, according to Treasury data.
(Reporting by Steven C. Johnson; Editing by Chizu Nomiyama)
9:10AM :
ALERT:
Week Begins With Extension of Friday's "Uneventful" Themes
Friday felt like a mildly breezy oasis amid the recent tempest of volume and volatility. 10yr yields held a 5bp range from 11am through the close. And yields remain in that same range now (2.22 to 2.27). Cases can be made for numerous technical levels right now, and while both of those qualify, there are more significant candidates above and below. MBS are similarly inside their post 11am range as the morning's economic data fails to inspire big moves. Fannie 4.0's are 1 tick worse on the day at 104-08 and 3.5's are 2 ticks better at 101-01. Does it still make sense to pay attention to 4.0's? A better question might be whether or not it makes sense to look at anything else (yet). While we fully expect 3.5's to get more of our attention if current levels persist, 4.0's continue to crush 3.5's in terms of production, seeing almost $1 bln of new originations just in 4.0's vs about $150 mln 3.5's (this comparison in conforming 30's... Ginnie's seeing a bit better mix of 3.5's/4.0's and 15yrs already prefer 3.0's). Not many reasons for rate sheets to be delayed this AM and on the surface, not many reasons to price any more defensively than normal, given the lack of volatility.
8:35AM :
ECON: NY Fed Manufacturing Contracts for 3rd Straight Month
(Reuters) - A gauge of manufacturing in New York State showed the sector contracted for the third month in a row in August as new orders fell to their lowest level since November 2010, the New York Federal Reserve said in a report on Monday.
The New York Fed's "Empire State" general business conditions index fell to minus 7.72 from minus 3.76 the month before. Economists polled by Reuters had expected a reading of zero.
The survey of manufacturing plants in the state is one of the earliest monthly guideposts to U.S. factory conditions.
New orders worsened to minus 7.82 from minus 5.45, while inventories fell to minus 7.61 from minus 5.56.
Employment gauges showed a slight improvement. The index for the number of employees inched up to 3.26 from 1.11 and the average employee workweek index rose to minus 2.17 from minus 15.56.
Prices paid eased, falling to 28.26 from 43.33. The index was also at its lowest level since November 2010.
The outlook for the months to come also deteriorated, falling to its lowest level since February 2009. The index of business conditions six months ahead dropping to 8.70 from 32.22.
(Reporting by Leah Schnurr, Editing by Chizu Nomiyama)
12:44AM :
New MBS Commentary Post
Featured Market Discussion
A recap of the featured comments from the Live Discussion on the MBSonMND Dashboard
.
Matthew Graham : "RTRS - NAHB AUGUST INDEX OF HOME SALES OVER NEXT SIX MONTHS 19 VERSUS REVISED 21 IN JULY "
Matthew Graham : "RTRS - NAHB AUGUST INDEX OF PROSPECTIVE BUYERS 13 VERSUS 12 IN JULY "
Matthew Graham : "RTRS - NAHB AUGUST INDEX OF CURRENT SINGLE-FAMILY HOME SALES 16 VERSUS 15 IN JULY "
Matthew Graham : "RTRS- U.S. AUGUST NAHB HOUSING MARKET INDEX 15 (CONSENSUS 15) VERSUS 15 IN JULY "
Jeff Statz : "All student loans with more than 10 payments must be included in the debt ratio, regardless of deferment status. Previously, when a monthly payment was not indicated on the credit report, Chase allowed the lender to calculate a monthly payment using 1% of the loan balance.
The new policy requires the lender to obtain documentation to support the verified payment amount and include that documented payment in the monthly debt calculation.
"
Jason York : "for student loans that are deferred for less then 3 years, and don't have a payment listed, what is the % you need to use for coming up with a payment? 2% or 5%?"
Adam Quinones : "one response to that MG...we are seeing 3.5 MBS coupon pricing on rate sheets but little 3.5 flows in TBA market. This is likely a factor of loan supply going directly into servicing portfolio of big banks bc of minimal liquidity in MBS market"
Matthew Graham : "Does it still make sense to pay attention to 4.0's? A better question might be whether or not it makes sense to look at anything else (yet). While we fully expect 3.5's to get more of our attention if current levels persist, 4.0's continue to crush 3.5's in terms of production, seeing almost $1 bln of new originations just in 4.0's vs about $150 mln 3.5's (this comparison in conforming 30's... Ginnie's seeing a bit better mix of 3.5's/4.0's and 15yrs already prefer 3.0's)."
Matthew Graham : "RTRS - FOREIGN HOLDINGS OF U.S. BONDS, NOTES IN JUNE SHOW NET SALES FOR FIRST TIME SINCE MAY 2009 "
Matthew Graham : "RTRS- U.S. OVERALL CAPITAL OUTFLOWS DOWN FOR 2 STRAIGHT MONTHS FOR FIRST TIME SINCE AUG-JULY 2009 "
Matthew Graham : "RTRS - JAPAN'S U.S. TREASURY HOLDINGS $911.0 BLN IN JUNE VS $912.4 BLN IN MAY "
Matthew Graham : "RTRS- CHINA'S U.S. TREASURY SECURITIES HOLDINGS $1.1655 TRLN IN JUNE VS $1.1598 TRLN IN MAY"
Matthew Graham : "RTRS - JUNE NET FOREIGN SALES OF US TREASURY BONDS, NOTES $4.5 BLN VS $38.0 BLN PURCHASES IN MAY "
Matthew Graham : "RTRS - U.S. JUNE NET LONG-TERM INFLOW (EX-SWAPS/OTHER) $3.7 BLN VS REV $24.2 BLN INFLOW IN MAY"
Matthew Graham : "RTRS - NY FED'S EMPIRE STATE NEW ORDERS AND PRICES PAID INDEXES AT LOWEST SINCE NOV 2010"
Matthew Graham : "RTRS - NY FED'S EMPIRE STATE 6-MONTH BUSINESS CONDITIONS INDEX AT LOWEST SINCE FEB 2009"
Matthew Graham : "RTRS- NY FED'S EMPIRE STATE SIX-MONTH BUSINESS CONDITIONS INDEX 8.70 IN AUGUST VS 32.22 IN JULY"
Matthew Graham : "RTRS- NY FED'S EMPIRE STATE NEW ORDERS INDEX -7.82 IN AUGUST VS -5.45 IN JULY"
Matthew Graham : "RTRS - NY FED'S EMPIRE STATE EMPLOYMENT INDEX AT 3.26 IN AUGUST VS 1.11 IN JULY"
Matthew Graham : "RTRS- NY FED'S EMPIRE STATE INDEX -7.72 IN AUGUST (CONSENSUS 0.00) VS -3.76 IN JULY"


