The Week Ahead: Risk On or Risk Off?
Stocks have rallied off long term support levels and bonds begun to back away from double-dip territory.
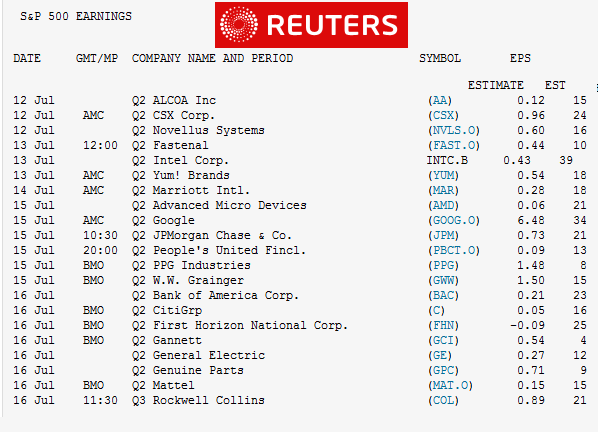
In the week ahead, the onset of Q2 earnings season is expected to test the pessimistic will of the macroeconomic investing environment. While microeconomic profits have been plentiful in recent quarters thanks to cost cutting measures, inventory reductions, a steep yield curve, and record productivity levels, one has to wonder when window dressings will no longer conceal the sad truth that has become the global growth outlook: SLOW AND STEADY WINS THE RACE
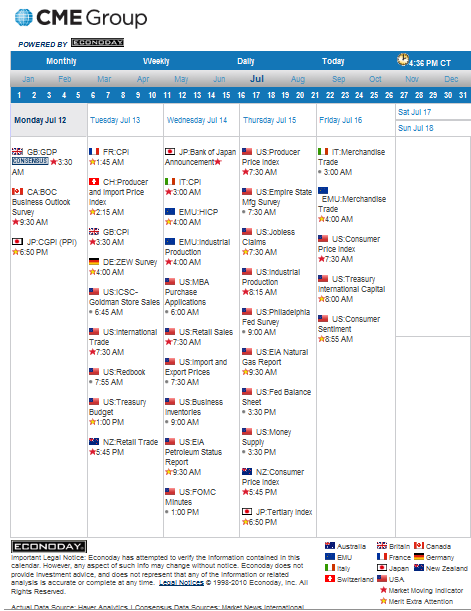
Besides earnings, the econ calendar holds price data, a couple of sentiment surveys, a look into what was said at the last FOMC meeting, Treasury auction supply concentrated in the "rate sheet influential end of the yield curve, and Ben Bernanke's talking head.
Remember: The June FOMC statement was skewed toward the bear's camp so market watchers will be perusing the text of the FOMC meeting minutes in search of double dip concerns.
This was my instant reaction to the June FOMC Statement release: The subtle alterations made to the statement were skewed to the bearish side of the BIG PICTURE storyline. This includes a reference of weakness abroad and definite dovish tone on inflation ("underlying inflation has trended lower" = deflationary concerns). Overall, the Fed didn't offer up any surprises. They did remove a portion of the text that said housing starts had picked up but they left the verbiage "remain at depressed levels" in tact. There was no change in the "low rates for an extended period" phrase and resource slack continues to prevent producers from passing along higher costs to consumers. MORE COLOR AND MARKET REACTION
BUSY WEEK!
Last but not least, contagion gets a second chance to grip market sentiment when EU finance ministers attempt to agree on the finer points of European bank stress tests.
(Reuters) - European finance ministers will shift their focus next week onto a possible need for banks to raise more capital and on who will cover any shortfalls exposed by stress tests -- a sum which Credit Suisse estimated could reach 90 billion euros ($114 billion). Euro zone finance ministers, meeting in Brussels on Monday and Tuesday next week, are expected to discuss the policy response countries will take if the tests show problems, an EU source said. Underscoring the sensitivity of the issue, European Central Bank President Jean-Claude Trichet on Friday reiterated the crisis was not over and banks should remain open to accepting help.
Rates Higher or Lower?
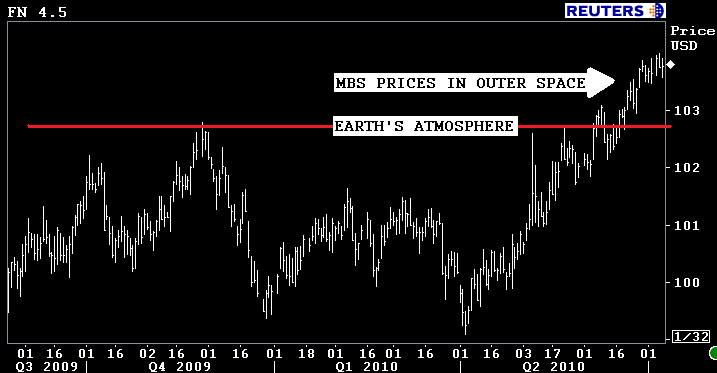
The July FNCL 4.5 is trading in outer space. Record prices have made record rebate possible on rate sheets.
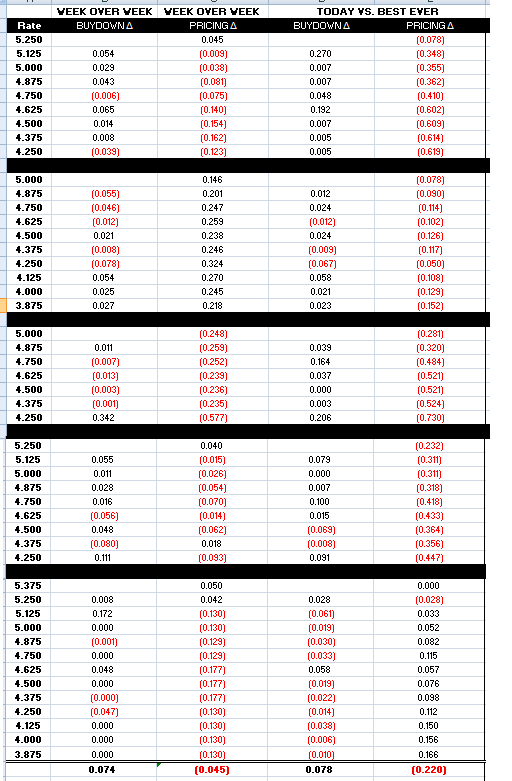
Loan pricing worsened on a week over week basis. Rebate reductions were largest in the cluster of note rates surrounding par with losses ranging from 10-25bps. Looking at our records, on Wednesday morning we saw the most aggressive loan pricing we've EVER seen. Below is a comparison. Notice PAR RATES TOOK THE BRUNT OF THE BEATING
Risk On? Risk Off?
Although BIG PICTURE perspective has been the primary source of risk averse investing pessimism, the market is still dominated by professional traders and market makers. While we like to focus on broader headlines and overall sentiment... directionality comes down to short term technicals and momentum.
Plain and Simple: It's still a trader's world and we're still living in it!
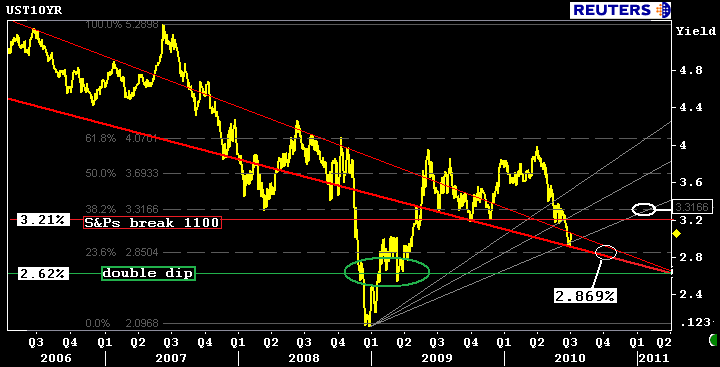
The long-term 10yr note yield chart shown below presents several technical studies including internal trendlines, fibonacci retracements, a fibonacci fan, and high-volume inflection points. If stocks rally, 10s have some room to run higher. Overhead support lies ahead in several spots including 3.12%, 3.17%, and 3.21%. If risk goes on special and bargain buyers step in, 3.27% is a bearish target and 3.31% is a line of demarcation ( long-term longs play defense). If the risk averse attitude intensifies, resistance is first found at 3.00%, then 2.97%, 2.92%, 2.87%...and 2.62% if "double dippers" really gain control.
In stocks we are entering a range that has been traded with great chopatility. Check out how long those candle bodies are in the chart below....specifically in the range between 1040 and 1111. This implies we should expect whippy price action to continue as traders balance short term flows and directional biases. Overhead resistance isn't far above at 1080, if that pivot is broken look out for a move toward 1089, then 1198, 1100, 1108, and 1111. A move through 1100 is sure to push 10-year yields up into the 3.20s (3.27%)

My Gut Feeling: S&P'S THROUGH 1080. RATES HIGHER
What's Your's?


