I gotta be honest.
I didn’t really watch the market too closely today.
I was late to my desk this AM. Pushed the day ahead out AFTER data was released. Then got sucked into commenting on a WSJ article titled, “Writing On The Wall: Mortgage Borrowers Take Blame, And Banks Agree”. After that it was excess inventory that grabbed my attention. Time magazine’s "Assignment Detroit” really got me thinking about the whole “bull dozing” approach to balancing out supply/demand. And before I knew it MG was asking me who was gonna write the MBS close and I hadn’t even eaten lunch yet.
Maybe that doesn’t make me the most qualified person to talk on the market today…
Eh. On second thought, I really didn’t miss too much. Not in the big picture at least.
Yeh yeh lenders did reprice for the better. But mortgage rates haven’t changed much lately. Loan pricing has been range bound at 6 months lows for about 3-weeks now. Best Ex on C30 paper has held steady between 4.75% and 5.00%.
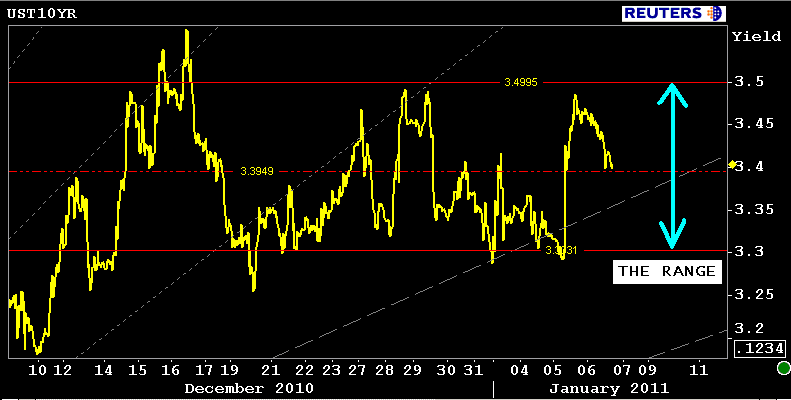
I was more intrigued by the market's defense of the 3.50% psychological pivot point yesterday afternoon. It comforted me to see real$ accounts hold that line in overnight trading. And then I felt a bit more relaxed to see real money add support to that position today (forced out short covering this AM).
This push-back puts 10s right in the middle of the recent range. Leaving room for 10s to travel as much as 10bps in either direction without breaking the broader trading range we outlined on Monday. Right in the middle!
Plain and Simple: Directional sentiment is very balanced heading into this data.
That's not so bad right?
Nah. 10bps in 10yr benchmarks is a common occurrence lately! Closing costs fluctuated as we chopped and consolidated around the range, but mortgage rates didn't change much in the process.
It would however mean something bigger if 10s moved 10bps in either direction…and then made a confirmed break outside the range. This is where the situation gets more intense for rate watchers.
The above illustrated benchmark trading range is interesting to me because it leaves the secondary mortgage market in a very unstable place. We’re teetering on a shift in duration bias in either direction!
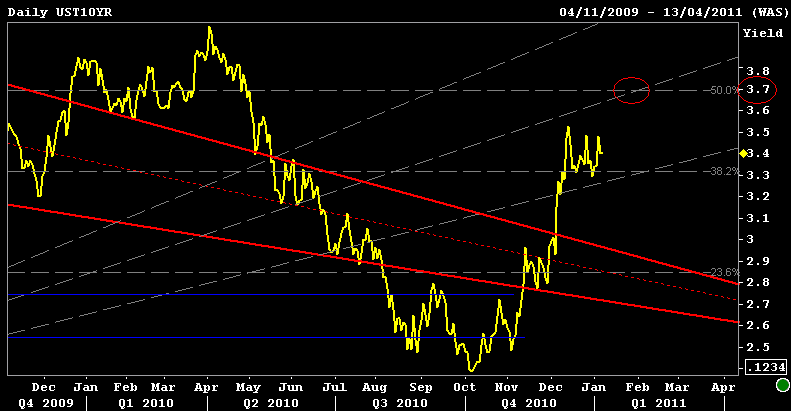
Meaning, if 10s break overhead yield support at 3.50% and confirm that break with volume, we’d be looking for 10s to test 3.70% at some point. If that played out, assuming 3.50% to 3.70% became our new trading range, the production MBS coupon could easily move to 5.0s and we’d be looking at “best execution” C30 mortgage rates in the 5.25% to 5.625% range. As we experienced in December, this jump doesn't take long. It can get violent if selling snowballs. READ MORE ABOUT EXTENSION RISK
See the crossroads of fibonacci retracements at 3.70%. I circled the crossroads. This is why 3.70% becomes our technical target if 10s confirm a breakdown of 3.50% support. 3.56% is our first major layer of support after 3.50%.
On the other hand...
If 10s travel 10bps lower and confirm a breakout through 3.30% yield resistance, and then found a way to enter the 3.00% to 3.17% range, lenders would be more willing to hedge with 4.0 MBS. This would allow mortgage rates to drift as low as 4.375%.
The move lower won't be quick though. And there are many more obstacles in the way vs. the straight line path that 10s could take toward 3.70%. That means if you're floating for a lower rate, and jobs data is dovish, you're probably still in for a wait, at least if you want to capitilize on rates below 4.50% again. That reduces the upside of floating if you ask me, especially when you consider the potential for the House to hold debt ceiling limits hostage. <---GREAT EXAMPLE OF POLITICS INFLUENCING MONETARY POLICY. This is where the so called bond vigilantes/short sellers build their case.
Plain and Simple: 10s have 10bps to run in either direction before we sound the alarm bells.
Ok now a closer look at NFP....
I can't tell you how NFP or the Household Survey will print tomorrow, but I can say they are both influential. Wall Street will probably focus on NFP while the Unemployment Rate tends to hit home on Main Street. These two survey's paint two very different pictures.
The Establishment Survey (NFP) private industry is creating jobs...consistently. Not a huge amount of jobs, but we're not shedding 4,5,6,700k a month anymore.
The the other side of the Employment Situation Report, the Household Survey (UNR) isn't so friendly on the eyes though. Not when we see 17% of able-bodied America stuck in the unemployment line or waiting for more hours. 42% of the unemployed have been without a job for longer than 27 weeks. That is 6.2 million Americans!!!!
This is the group Ben Bernanke and the FOMC are worried about leaving behind. Main Street tends to side with this portion of the data while Wall Street has been appeased purely by the fact that heads are no longer rolling (NFP growth). All this makes me wonder if a jump in the unemployment rate might just cancel out upward revisions to NFP growth or a better than expected December print.
We've been seeing much seasonal distortion in the data lately. This forces the street to approach each report from a smoothed out approach, meaning economists and traders are taking each report in context of the recent trend and discounting any outliers as heavily influenced by statistical adjustments.
Strong ADP Print Implies Upward Revisions Needed on NFP Estimates
Seasonal Distortions Seen in Jobs Data
Jobless Claims Distorted by Seasonal Adjustments. 4-Week Trend Still Implies Improvement
EMPLOYMENT SITUATION REPORT PREVIEW FROM REUTERS...
Expectations are growing for strong numbers when the government’s December nonfarm payrolls report is released. On Wednesday, after ADP data showed private payrolls leaped nearly three times more than forecast, some economists raised their forecasts for the government number.
A Reuters poll showed they now foresee the U.S. added 175,000 jobs last month, up from 140,000 before the ADP number was released. Last month’s figure was a gain of 39,000. However, analysts caution that heightened expectations also increase the scope for disappointment if the outcome falls short.
In raising their forecasts, analysts argued that the increase in the ADP report was just too large to ignore, despite acknowledging ADP's poor record at predicting nonfarm payrolls. Economists kept their median unemployment rate forecast for December at 9.7 percent, what they had forecast before ADP.
Recent data ranging from retail sales to manufacturing strongly suggest the economy gained momentum as 2010 wound down. But these signs of strength will not mean much unless they are accompanied by a pickup in employment.
December's employment report will be weighed by Federal Reserve officials when they meet on Jan. 25-26 and could influence investors' bets on whether the central bank will complete its much criticized $600 billion government bond buying program. The stream of upbeat data has some economists speculating the Fed will reconsider the so-called quantitative easing program, which aims to stimulate demand by driving already low borrowing costs down further.
At its last meeting on Dec. 14, the Fed still regarded the recovery as weak, despite the improvement in economic data. Minutes from the meeting released on Tuesday said some policymakers indicated a "fairly high" threshold for curtailing the program. Better employment prospects for December were bolstered by the fact that weekly claims for state unemployment benefits declined for much of the month, touching their lowest level since July 2008 during the Christmas holiday week. Separately, Canadian job figures are also due and its unemployment rate is seen rising to 7.7 percent from 7.6 percent.


