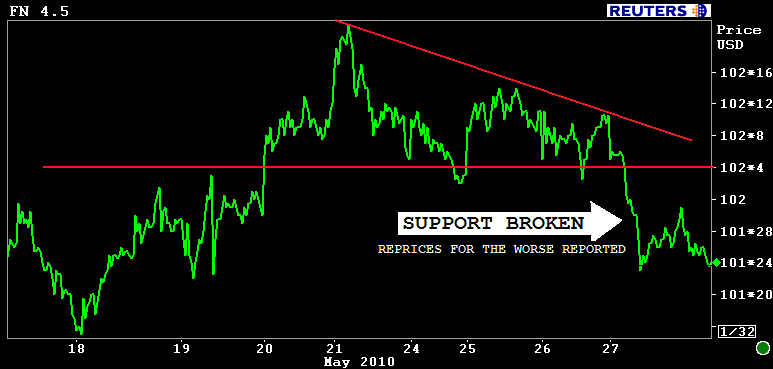
- FN45 High: 102-09. FN45 Low: 101-22. FN45 Close: -0-18 at 101-24
- Current Coupon +14.8bps at 4.205%
- Yield Spreads Slightly Tighter vs. TSYs and Swaps
- 10s +16.5bps at 3.192%. -1-13 in price. 5yr note yield is worst performer: +17.9bps today
- Healthy Concession Balances Demand For 7-Year Auction. READ MORE
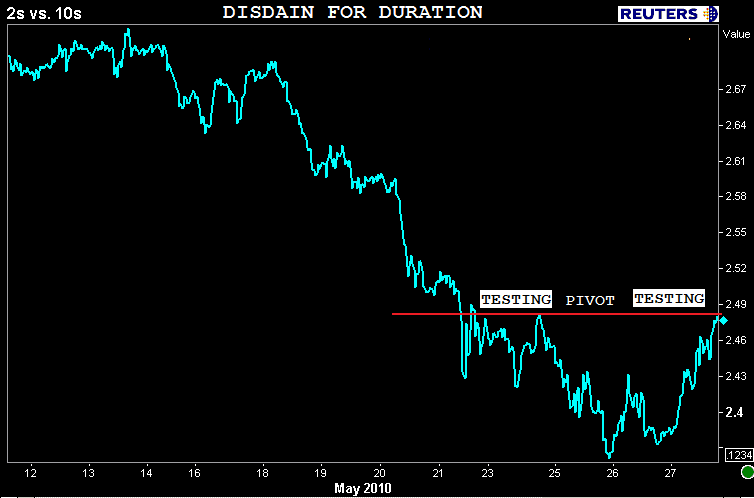
- 2s/10s: 11bps steeper at 248bps.
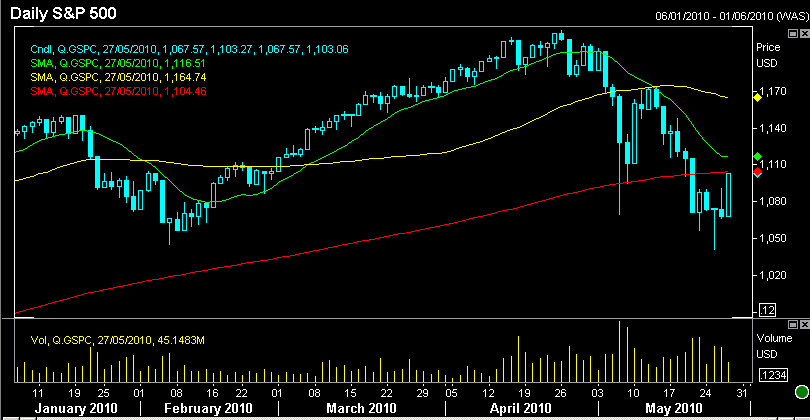
- S&P Open: 1067.57. High: 1103.27. Low: 1067.57. Close: +3.29% at 1103.06
- Econ Data and Mortgage Rate Recap HERE
It's not tough to figure out what drove MBS price levels lower today. Stocks rallied, flight to safety positions in TSYs were liquidated and "rate sheet influential" MBS prices went out near seven session lows.
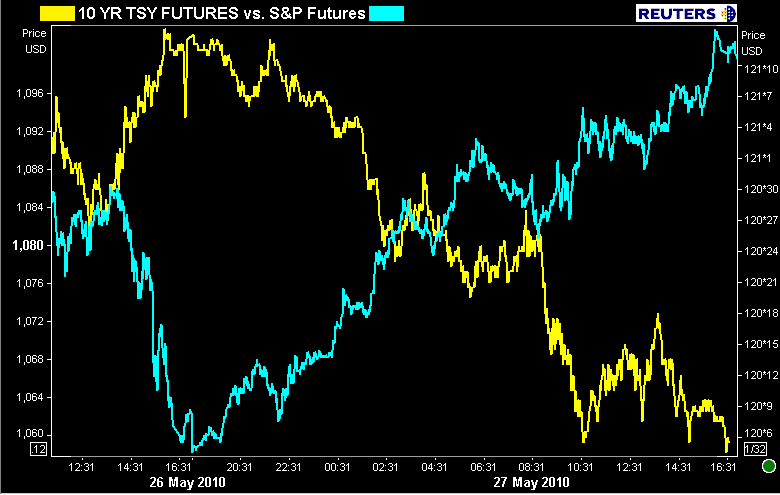
The stock lever's influence is a bit more obvious when comparing Treasury futures to Equity futures. Their movements mirror each other.
The rally was broad based too...

Momentum carried all the way into the close and the S&P ended the day just off its session highs. +35 handles is an impressive S&P rally...very impressive. Two other observations. Stocks rallied from yesterday's close straight through to today's. And check out the inverted Head and Shoulders pattern in THIS POST
S&Ps run into resistance at 1104...the 200 moving average...the next major pivot is 1116.
The mass exodus from the massively overbought yield curve pushed benchmark rates higher, double digit yield increases were seen in every coupon but the newly issued 0.75% 2yr note. Recently auctioned 5-yr notes were the worst performer, down 20 ticks in price, up 17.9bps in yield. Things weren't much better further out the curve though. 7s: +15bps, 10s: +16.5bps, 30s: +15.9bps. The 2s/10s curve was 10 bps steeper at 248bps...clearly demonstrating the market's disdain for duration. (Duration = rate sheet influential. Duration = where much flight to safety $$$ was parked)
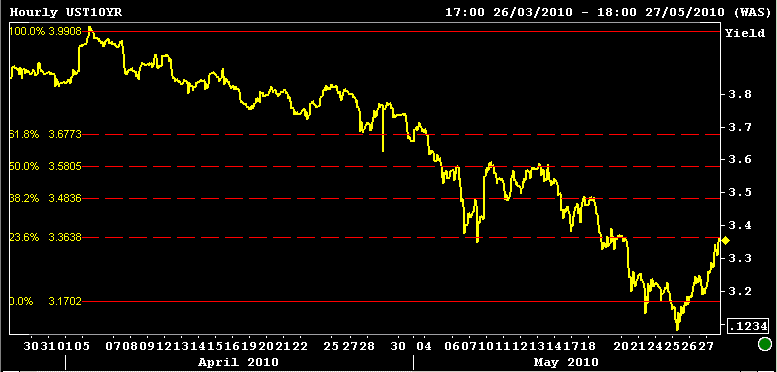
10s finally stopped bleeding at the 23.6% retracement of the 2010 yield highs (flip to daily chart for fibo. too). The trend is no longer our friend.....
Don't overlook month-end window dressing's role in this bond market sell off. Up until today, market participants had the majority of their cash parked in the long end of the yield curve as this provided a safe haven from volatility while still producing an acceptable return. A portion of the appetite for risk we saw today was likely a factor of month end portfolio rebalancing/window dressing (too many duration heavy bonds)...
Unfortunately that doesn't change the fact that the violent spike in rates will force market participants to re-evaluate their strategic and tactical biases as bullish interest rate technicals have officially reversed course. The stock lever is still our primary guidance giver though. If stocks rally on, interest rates will rise. If stocks fail to maintain momentum, interest rates will benefit and 10s will retest 3.31%.
WHAT SAY YOU...ARE STOCKS HEADED HIGHER OR LOWER? DID WE LEARN ANYTHING NEW TODAY THAT MIGHT WARRANT THIS STOCK MARKET RALLY? IS THIS A WINDOW DRESSING RALLY?
I find it ironic that this interest rate sell off took place on the one year anniversary of Black Wednesday.


