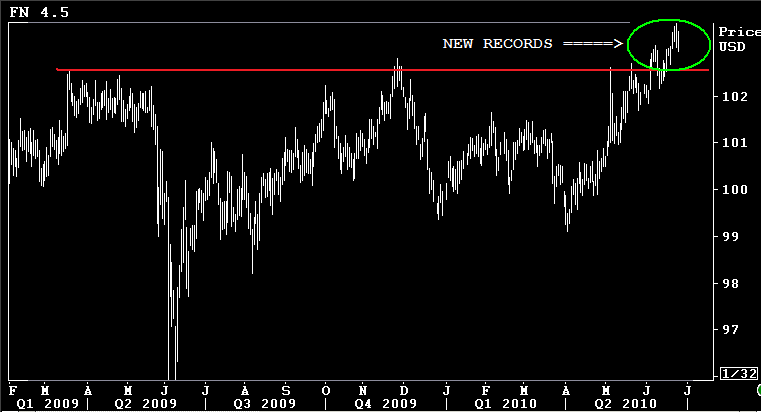
- JULY FNCL 4.0: +12 at 100-26 (100.813) AUGUST FNCL 4.0: +0-12 at 100-16 (100.500)
- Secondary Market Current Coupon: -0.3 bps at 3.911%
- CC Yield Spreads:+80.1bps/10yTSY. +73.4bps/10yIRS. WIDER ON THE WEEK
- UST10YR: +2.6bps at 3.11%. 2s/10s: UNCH at 246bps. 7YR NOTE=LEAST BEST PERFORMER
- S&P CLOSE: +0.29% at 1076.76 HIGH: 1083.33 LOW: 1067.98 BEST SECTOR:Financials +2.81%
Well. Here we are. The Fed stopped buying mortgages months ago, yet MBS prices are at all-time highs (AGAIN). Give or take a few basis points, we can officially say mortgage rates are priced at the best levels we've seen in our lifetime. At least since the secondary market was formed in the early 70s....

We've priced in much headline news risk and watched a big old "I'm scared hold me" flight to safety into U.S. Treasuries.
The headlines: Greece/Spain/Portugal/China/North Korea/Iran/Germany/Financial Reform/Oil Spills.
Unfortunately, global markets are now shifting a skeptical eye toward the U.S. ECONOMY. The political environment is ripe with confusion and chaos. And Housing is hanging in the balance...there are soooo many unanswered questions!
When will the USDA Rural Program be reinstated? When will the flood insurance program be extended? Will Congress eliminate YSP, and thumb their noses at the basics of bond mathematics? Will the June 30th deadline for the approval of loans for the First Time Home Buyer Tax Credit be extended? Will HVCC be eliminated, with the comment, "It had good intentions, but poor execution", and will appraisals be portable? Will securitizers be required to keep 5% of MBS volume in reserves as risk retention?
IN THE BIG PICTURE, markets are questioning whether or not we've actually escaped the grasp of downward deflationary spiral. This week the FOMC sounded more dovish when they tweaked the verbiage of their policy statement to read: "underlying inflation has trended lower".
Has the worst really been priced into asset valuations yet?
I don't know but bond yields indicate the market is concerned about the potential of another leg lower in risk markets. The benchmark 10 year note is bordering a range breakout toward yield levels not visited since the economy was in free-fall during the latter months of 2008. The red trend channel is what I've got my eyes on. When combined with long term pivots and fibonacci fans, all signs point toward a test of 3.00%....but Treasuries are way overbought and there are less expensive investment opportunties available in related markets (high-opporunity cost!). It comes down to the market's appetite for risk: STOCKS

The stock rally we thought was made of glass...shattered this week. S&Ps trended lower in an impulsive manner everyday until selling stopped out at a KEY PIVOT POINT today. Price action could be characterized as apathetic early on in the week but participation definitely increased as support levels were broken. This could be a good thing as it may imply sellers are being washed out. What makes me think it is not a good thing was an increase in stock futures open interest today. This means the number of open contracts (positions) rose, and when you combine that with an uptick in volume into declining price action...it leads me to believe traders were selling S&Ps short because they felt stocks were headed lower. The only sign of hope for equity bulls was a late day rally that pushed the S&P futures contract back above the 1070 pivot. Other than quarter end bargain buying hopes...the stars are aligned for stocks to sell and for 10s to test the 3.00% level.

The importance of 1070 is more obvious in the below daily chart of the S&P 500 index. A break below here implies the market will look to test just how bearish the world really is about the U.S. economy. 1050 is the next major level of support followed by firmer support at 1040. If stocks bounce and trade higher, they'll run into modest resistance at 1080, firmer resistance at 1090, then even firmer resistance at the 200day moving average (teal).

If we're really headed for a double dip, interest rates will surely move lower. I'm just not sure how much further mortgage rates can fall though.
The last time benchmark yields dipped below 3.00%, mortgage rates lagged badly (yield spreads were much wider). The most aggressive quote we saw during that downturn was 4.25%. Some lenders were offering 4.125%, but those opportunities were few and far between....
WHY?
It was a factor of how mortgage notes are delivered into MBS coupons. The lowest note rate that can be used to fulfill a 4.0 trade: 4.25%. If the lender wants to sell forward a 4.125% note rate in the TBA MBS market, they'd have to sell it as a 3.50 MBS coupon. Well, because there was never liquidity in the 3.5 MBS market, at least not for anyone looking to sell forward their pipeline "IN SIZE", mortgage rates never made a solid attempt at 4.00%. Read liquidity as: A seller being able to find a willing buyer without having their offer price hit badly because there were no other willing buyers (buyer's market).
Right now the 3.50 MBS market is considered "phantom" (8 tick bid ask spread), there aren't enough buyers out there who are willing to take on the added extension risk, so the lowest rate lenders are offering consumers : 4.25%! In the short term, mortgage rates are above 4.25%, so there is room for mortgage rates to improve if 10s rally down to 3.00%. If that happens we may see another day like yesterday.
Besides all out depression, I'm not sure what would drive the TBA MBS market to trade 3.50 MBS. My best guess: 10s need to range trade between 2.65% and 2.85%. Even then I find it hard to believe dealers would be willing to take on that much extension risk without tagging sellers with a hefty price discount.


