30YR Fixed Rate
6.73%
+0.06%
15YR Fixed Rate
5.97%
+0.06%
UMBS 30YR 5.5
99.71
-0.13
10 Year Treasury
4.332
+0.052
  • Home
  • News
    Latest Headlines
    Bonds Circle The Wagons Ahead of High Risk NFP
    Wed, 3:43 PM
    Rates Finally Rise Ahead of Jobs Report
    Wed, 2:53 PM
    Processing, Lead-Gen Tools; HELOCs, 2nds, Non-Agency Products; Maryland's DSCR Controversy
    Wed, 11:51 AM
    Bonds Think About Rallying on ADP Data, But Already Getting Cold Feet
    Wed, 9:54 AM
    Traders Buy The Dip After AM Data
    Tue, 4:06 PM
    News Headlines
    • Home Page
    • View All Headlines
    Newsletters
    • Daily Newsletter
    Popular News Topics
    • Housing News
    • Mortgage Rate Watch
    • MBS Live Commentary
    • Rob Chrisman
    • Video News
    • Around the Web
    View Latest Headlines
    Close Menu  
  • Mortgage Rates
    Current Mortgage Rates
    30 Year Fixed Rate
    6.73% +0.06
    Rate Data
    • Today's Mortgage Rates
    • Compare Rates from Local Lenders
    • MND's Daily Rate Index
    • About MND's Daily Rate Index
    • Freddie Mac | MBA
    • 30 Year | 15 Year
    • Jumbo | FHA | 7/6 SOFR ARM | VA
    • Mortgage Rate Watch | Subscribe
    • Live Market Report (PDF)
    • Rate Volatility Index
    • Rates by State
    • 30YR vs MBS | 30YR vs 10YR
    • 10YR vs MBS
    Mortgage Calculators
    • Payment w/ Amortization
    • Mortgage Loan Comparison
    • Early Payoff
    Rate Commentary
    • Mortgage Rate Watch
    Additional Rate Data
    • 30 Year | 15 Year
    • Jumbo | FHA | 7/6 SOFR ARM | VA
    • Freddie Mac | MBA | FHFA
    • 30YR vs MBS | 30YR vs 10YR
    • 10YR vs MBS
    Additional Charts
    • 30 YR vs. MBS | 30YR Fixed vs. 10YR Tres
    • 30 Yr Fixed vs. 10 YR Treasury
    • 10YR Tres vs. MBS
    Learn About Rates
    • What is a Mortgage?
    • Mortgage Rates Defined
    • What Makes Rates Change?
    • Mortgage Rates and MBS
    • More Questions
    Rate Widgets
    • Mortgage Rates Widgets
    • Mortgage Calculator Widgets
    Widgets
    • Mortgage Rates Widgets
    • Mortgage Calculator Widgets
    Current Mortgage Rates
    Close Menu  
  • MBS
    Today's MBS Prices
    UMBS 30YR 5.5
    99.72 -0.13
    Current Treasury Prices
    10 Year US Treasury
    4.3300 +0.0502
    MBS Data
    • MBS & Treasury Prices
    • Current MBS Prices
    • UMBS | GNMA
    • Treasury Prices
    • 10YR|30YR
    • Yield Curve
    • Current Mortgage Rates
    Market Commentary
    • MBS Market Commentary
    More Charts
    • MBS vs 30 YR Fixed
    • 10YR vs 30 YR Fixed
    Learn About MBS
    • MBS Basics
    • Mortgage Bonds and Securitization
    • MBS and Mortgage Rates
    • The GUTFLOP
    MBS Live
    • MBS Live Features
    • 2 Week Free Trial
    Today's MBS Prices
    Close Menu  
  • Housing Data
    Housing Production
    • Building Permits
    • Housing Starts
    • Under Construction
    • Housing Completions
    • NAHB Builder Confidence
    Home Sales
    • New Home Sales
    • Existing Home Sales
    • Pending Home Sales
    Home Prices
    • FHFA Home Price Index
    • S&P Case Shiller Index
    • New Home Prices
    • Existing Home Prices
    Homeownership
    • Vacancy Rate
    • Homeownership Rate
    Mortgages
    • Mortgage Applications
    Close Menu  
  • Share
  • Subscribe
  • Home
  • News
    • Top News
    • Latest Headlines
    • Mortgage Rate Watch
    • MBS Commentary
    • Rob Chrisman
    • Video News
    • Around the Web
    • Other
    • Daily Newsletter
  • Mortgage Rates
    • Mortgage Rates
    • Today's Mortgage Rates
    • Mortgage Rate Wach
    • Mortgage Calculators
      • Mortgage Payment w/ Amortization
      • Mortgage Loan Comparison
      • Early Payoff
    • Learn About Rates
      • What is a Mortgage?
      • Mortgage Rates Defined
      • What Makes Rates Change?
      • Mortgage Rates and MBS
      • More Questions
    • More Data
      • Rate Volatility Index
      • 30 YR Fixed vs. MBS
      • 30 Yr Fixed vs. 10 YR Treasury
      • 10 YR Treasury vs. MBS
    • Rate Surveys
      • Mortgage News Daily
      • Freddie Mac
      • MBA
    • Rates by Loan Type
      • 30 YR Fixed
      • 15 YR Fixed
      • 30 YR Jumbo
      • 30 YR FHA
      • 7/6 SOFR ARM
      • 30 YR VA
  • MBS
    • Today's MBS Prices
    • Treasury Yields
      • 10 Year
      • 30 Year
      • All Treasuries
    • MBS Commentary
    • Charts
      • MBS vs 30 YR Fixed
      • 10YR vs 30 YR Fixed
      • Yield Curve
    • Learn About MBS
      • MBS Basics
      • Mortgage Backed Bonds and Securitization
      • MBS and Mortgage Rates
      • The GUTFLOP
    • MBS Live
  • Housing Data
    • Housing Production
      • Building Permits
      • Housing Starts
      • Under Construction
      • Housing Completions
      • NAHB Builder Confidence
    • Home Sales
      • New Home Sales
      • Existing Home Sales
      • Pending Home Sales
    • Home Prices
      • FHFA Home Price Index
      • S&P Case Shiller Index
      • New Home Prices
      • Existing Home Prices
    • Homeownership
      • Vacancy Rate
      • Homeownership Rate
    • Mortgages
      • Mortgage Applications
Daily Newsletter - FREE
Delivered to over 70,000+ industry professionals each day, the Daily Newsletter is the definitive recap of the day's most relevant mortgage and real estate news and data. View the latest Newsletter below.
Most Recent     VIEW ALL »
Subscribe to our Daily Newsletter
It's FREE, and always will be.
  • Delivered to over 70,000+ Industry Professionals and Consumers Daily
  • Recaps the Day's Latest News and Market Commentary
  • Mortgage Rate and MBS / Treasury Price Summary
Most Recent     VIEW ALL »
Newsletter Preview
View our most recent newsletter below, or use the date selector to view past newsletters.
The CoreLogic Home Price Index puts the annual rate of appreciation nationally at 4.7 percent in December and the gain from November 2018 to December at 0.1 percent. All states but Louisiana and North Dakota had price increases over the 12 months ended in December 2018. The highest rates were in Idaho at 11.7 percent, Nevada at 10.8 percent, and Utah, 8.7 percent. Frank Nothaft, CoreLogic's Chief Economist noted that price increases have been moderating. "Higher mortgage rates slowed home sales and price growth during the second half of 2018. Annual price growth peaked in March and averaged 6.4 percent during the first six months of the year. In the second half of 2018, growth moderated to 5.2 percent. For 2019, we are forecasting an average annual price growth of 3.4 percent." The CoreLogic
MND logo
February 5, 2019
Download our Mobile App:
Download from Google Play
Download from Apple App Store
View the QR Code
Download our Mobile App:
Download from Google Play
Download from Apple App Store
Housing News
Moderating Home Prices May Turn the Tide for Would-be Buyers
The CoreLogic Home Price Index puts the annual rate of appreciation nationally at 4.7 percent in December and the gain from November 2018 to December at 0.1 percent. All states but Louisiana and North Dakota had price increases over the 12 months end... (read more)
MBS Commentary
MBS Live Day Ahead: Which Side of the Market is Lying?
This is a concept we've revisited a few times over the years and it goes something like this: A strengthening economy implies rising earnings/profits among companies and therefore, higher stock prices.  The same strengthening also supports hi... (read more)
Rob Chrisman
LO Products, Digital White Paper; Training Events Across the Country and at Home
The other day I was on a Southwest flight and I noticed someone on the aisle seat crumple up a couple of unused tissues and put them on the empty middle seat so that no one would want to sit there. What’s up with that? For something that won&rs... (read more)
Mortgage Rate Watch
Mortgage Rates Quickly Retreating After Hitting Long-Term Lows
Mortgage rates continued moving higher today as Fridays unfortunate series of events seems to have motivated a big bounce. What events are those? Namely, we're talking about several important economic reports including the big jobs report and the mos... (read more)
Housing News
Lower Rates and Slower Price Gains to Help Affordability in 2019
Although they covered the topic in last month's Mortgage Monitor , further declines in interest rates have prompted Black Knight to take another look at the impact on the refinance pool. The previous edition reported that the 30-basis point drop in t... (read more)
MBS Commentary
MBS Live Recap: Bond Market Not a Fan of Mondays--At Least Not This One
Chinese markets were closed overnight for New Year.  This slowed trade somewhat.  Coupled with a lack of significant economic data this morning, it also put more emphasis on the events from the previous trading day.  In this ... (read more)
Mortgage Rates
30 Yr. Fixed Rate
6.73% +0.06%
Rate Change Points
Mortgage News Daily
30 Yr. Fixed 6.73% +0.06 0.00
15 Yr. Fixed 5.97% +0.06 0.00
30 Yr. FHA 6.25% +0.06 0.00
30 Yr. Jumbo 6.84% +0.04 0.00
7/6 SOFR ARM 6.33% +0.04 0.00
30 Yr. VA 6.26% +0.06 0.00
Updates Daily - Last Update: 7/2
15 Yr. Fixed Rate
5.97% +0.06%
Rate Change Points
Freddie Mac
30 Yr. Fixed 6.77% -0.04 0.00
15 Yr. Fixed 5.89% -0.07 0.00
Updates Weekly - Last Update: 6/26
Rate Change Points
Mortgage Bankers Assoc.
30 Yr. Fixed 6.79% -0.09 0.62
15 Yr. Fixed 6.06% -0.05 0.67
30 Yr. Jumbo 6.78% -0.10 0.40
Updates Weekly - Last Update: 6/26
MBS / Treasuries
UMBS 30YR 5.5
99.70 -0.15
Price / Yield Change
MBS
UMBS 5.5 99.71 -0.13
UMBS 6.0 101.48 -0.09
GNMA 5.5 99.91 -0.06
GNMA 6.0 101.18 -0.23
Pricing as of: 7/3 10:52AM EST
10 Year US Treasury
4.3314 +0.0516
Price / Yield Change
US Treasury
2 YR Treasury 3.879 +0.091
5 YR Treasury 3.932 +0.065
7 YR Treasury 4.117 +0.061
10 YR Treasury 4.332 +0.052
30 YR Treasury 4.846 +0.037
Pricing as of: 7/3 10:52AM EST
Latest Video
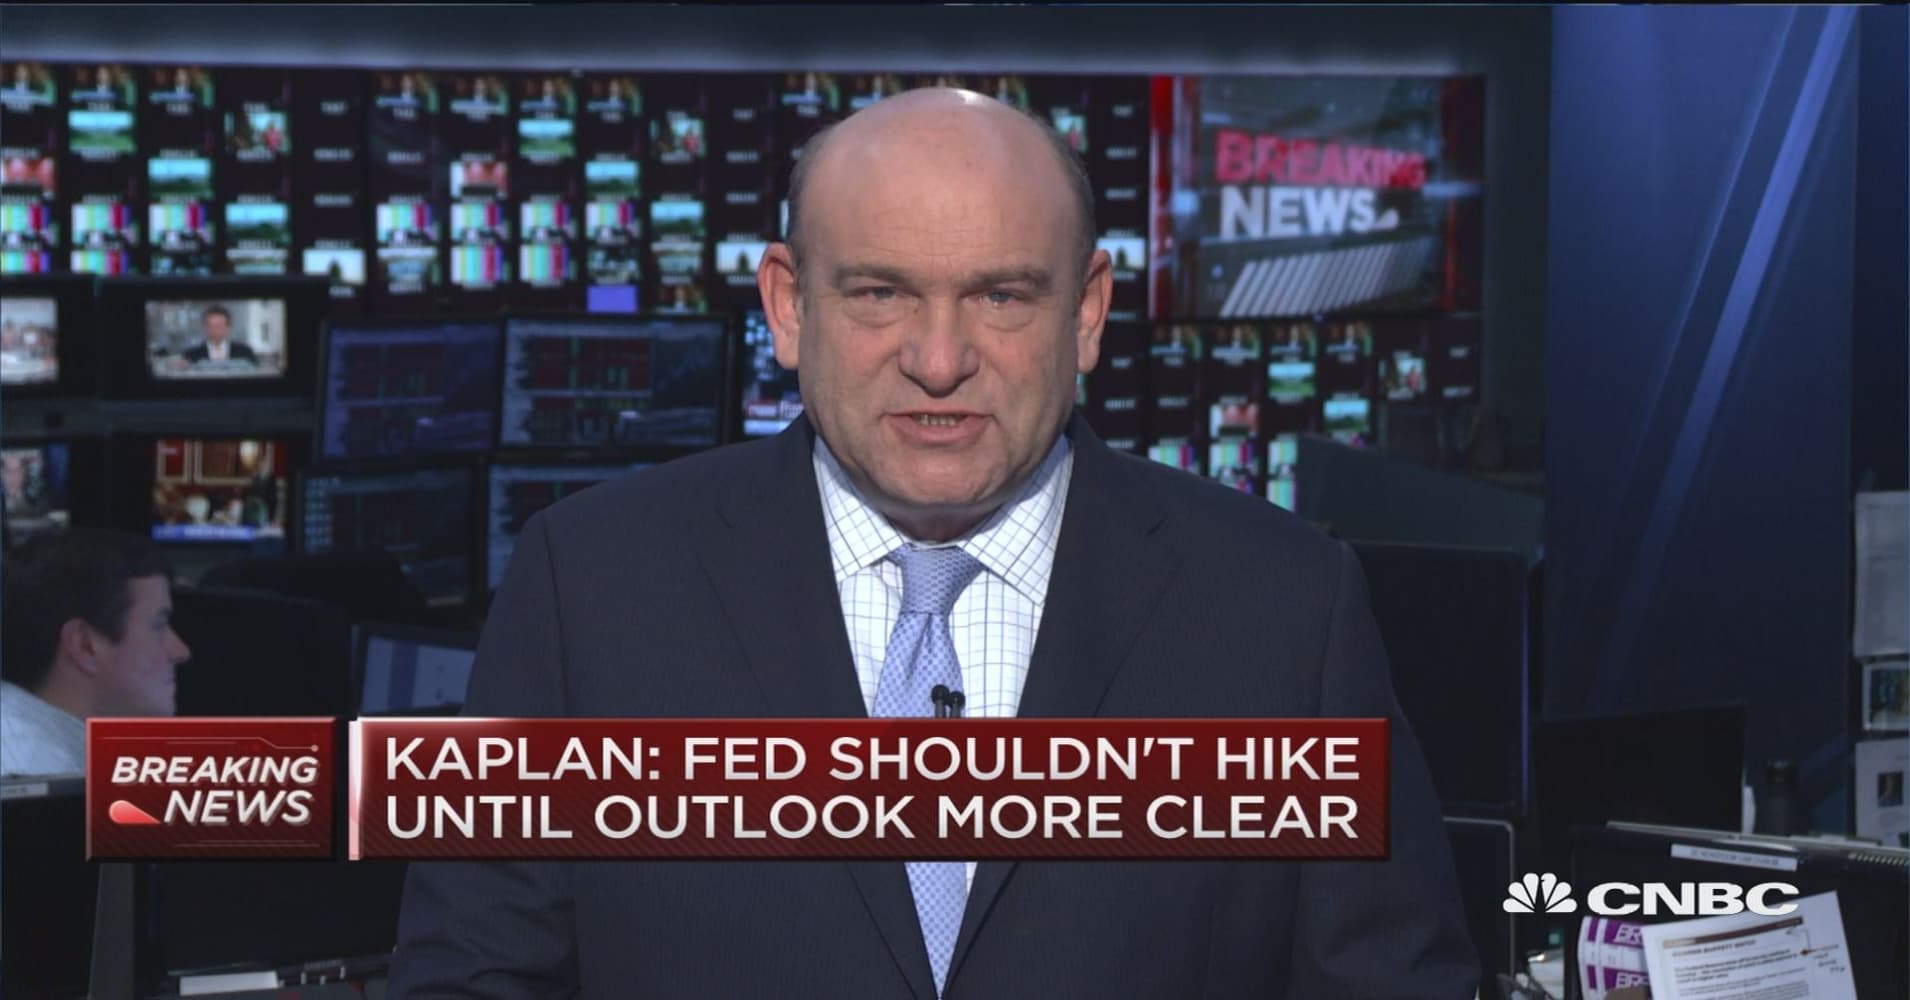
Fed shouldn't hike rates until outlook is clear: Dallas Fed president
January ISM non-manufacturing data falls short of expectations
Why Allianz's Mohamed El-Erian gives Fed Chair Powell an 'A'
Around the Web
Calculated Risk Blog
Update: The Endless Parade of Recession Calls
NAR - Realtor.com
Luxury House Flipping Is on the Rise, but Still Lower Than Before the Recession
CNBC
The state of housing demand is suddenly good again but it could be temporary
Bloomberg
Lifeless Treasury Market Needs a Jolt From Pile of Parked Cash
Calculated Risk Blog
ISM Non-Manufacturing Index decreased to 56.7% in January
NAHB Eye on Housing
Share of Buyers Expecting an Easier House Search Drops from 27% to 19% in a Year
CNBC
The Fed's next rate move is more likely a cut than a hike: Economist Mohamed El-Erian
Calculated Risk Blog
CoreLogic: House Prices up 4.7% Year-over-year in December
Reuters
Exclusive: Fed could raise rates as much as twice this year - BlackRock's Rieder
Bloomberg
Stop Worrying About the Fed's Balance Sheet
consumerfinancemonitor.com
CFPB Publishes Informal Guidance on the TRID Rule
Redfin
Homes Staying on the Market for a Month Longer Than Last Year in San Jose, Portland, and Seattle
NAR - Realtor.com
The Average Adjustable-Rate Mortgage Is Nearly $700,000. Here's What That Tells Us.
© 2025  Mortgage News Daily, LLC. | 19701 Bethel Church Rd. | Cornelius, NC 28031
Interest rates displayed are national averages and for informational purposes only. Actual rates from lenders may vary based on several factors including, but not limited to, credit worthiness, ability to replay, credit score, down payment, loan term, etc.
This email was sent to: [recipientemail]. Go here to UNSUBSCRIBE from this email.
Today's Mortgage Rates  |  Mortgage Calculators
7/2/2025
30 Yr. Fixed Rate
6.73%
+0.06%
0.00
MBS & Treasury Prices
UMBS 30YR 5.5
99.72
-0.13
10 Year US Treasury
99.333
-0.427
HOME
MORTGAGE RATES
MARKET DATA
MORTGAGE CALCULATOR
NEWSLETTERS
MBS LIVE

Home

  • Home Page

Popular

  • Mortgage Rates
  • MBS Prices
  • Mortgage Calculators
  • Co-branding

Stay Informed

  • Download our Mobile App
  • Daily Email Newsletter
  • MBS Live

Support

  • Contact Us
  • Search
  • FAQs
  • Learn

Popular

  • Home Page
  • Mortgage Rates
  • MBS Prices
  • Mortgage Calculators
  • Housing Data
© 2025 - Mortgage News Daily, LLC.  |  Terms of Use  |  Privacy Policy