Wednesday May 22nd, and we finally get to see what all the fuss is supposedly about. The "fuss" or hype, if you prefer, was theoretically kicked into high gear by a somewhat bungled pre-release 'leak' of a Hilsenrath story about the Fed 'mapping an exit strategy.' Bond markets started selling off around the same time, but the extent to which this had much to do with the announcement of the impending Hilsenrath article is still a matter of debate.
Reason being: it coincided with two or three other contenders that would have also been sufficient to engender such a spike. Well before any of the drama began, we'd discussed our own 'mapping' HERE, highlighting the risks that the May selling trend would continue and pointing out the technical ledge at 1.83-ish in 10yr yields as being a massively important inflection point (see the CHART at the bottom of that page).
Couple that with Bernanke's odd comment saying the Fed was keeping their eyes peeled for signs that investors were "reaching for yield," as well as the fact that bond markets never got a good chance to "distribute" newly acquired inventory after the past 2 days of long-end Treasury auctions and the stage was set for a classic whodunit. Technicals, tradeflows, Bernanke, and post Auction distribution probably 'dunit' a lot more than Hilsenrath, but all of that was lost in the shuffle by the following Monday.
To Hilsenrath's credit, most of the Fed speeches since then have seemed to pay an increasing amount of attention to tapering QE3. The conspiracy theorist in many a market participant wondered aloud if it was all a set-up to grease the skids for unpalatable realities in the Fed Minutes. And while such conspiracies are still possible, trading levels tell us it hasn't much mattered considering 10's closed out Tuesday at the same 1.92's they hit on May 10th (the painful part has been all the volatility between now and then, but yeah... same levels. Go figure).
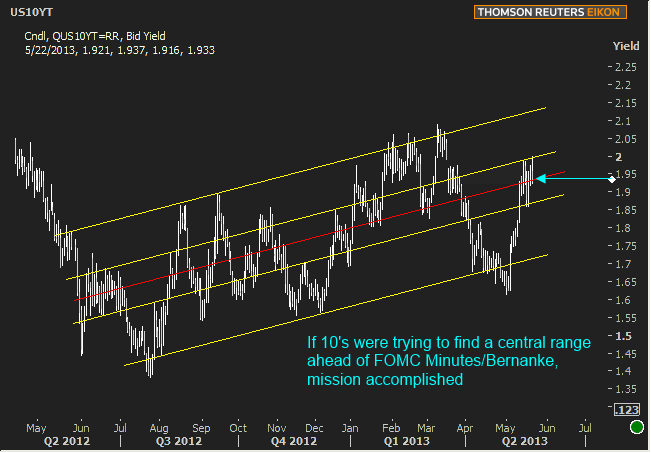
We've also made the argument that the lead-up to the last jobs report could merely have been a "lead-off" to account for the most bullish of possibilities, while the broader long term trend remains upwardly sloped for rates. Although that's just one way of looking at things, it makes a compelling backdrop against which to consider that Treasuries have merely sought the center of that range ahead of the next big dose of information--the exact center.

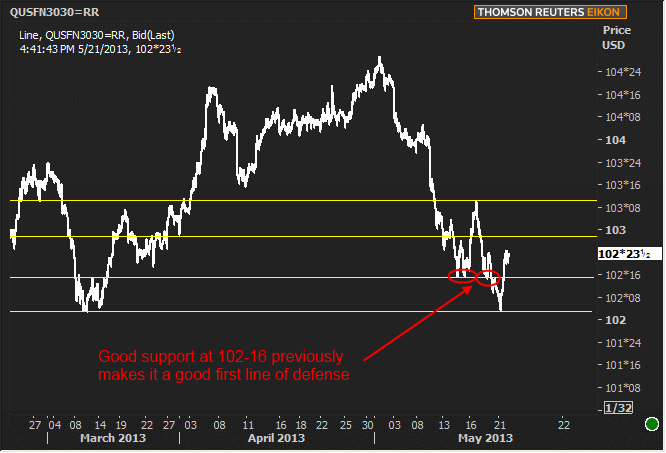
As far as the Treasury chart above, the central range (the two yellow lines on either side of the red line) would be the first two lines in the sand today with the outer lines being outside possibilities (even then, they feel extreme for what, by all rights, could turn out to be a day that's just as likely to go flat as it is to move big). MBS have offered a few technical clues in recent days as well and are similarly right in the middle of their two most recent high/low spikes (though we'd note that 102-16 was a more frequently visited support level of late, and the first line of defense against the possibility of weakness).

|
Week Of Mon, May 20 2013 - Fri, May 23 2013 |
|||||
|
Time |
Event |
Period |
Unit |
Forecast |
Prior |
|
Mon, May 20 - Tue May 21 |
|||||
|
-- |
No Significant Scheduled Data |
-- |
-- |
-- |
-- |
|
Wed, May 22 |
|||||
|
07:00 |
Mortgage market index |
w/e |
-- |
-- |
876.6 |
|
10:00 |
Existing home sales |
Apr |
ml |
5.00 |
4.92 |
|
10:00 |
Exist. home sales % chg |
Apr |
% |
1.5 |
-0.6 |
|
14:00 |
FOMC Minutes |
-- |
-- |
-- |
-- |
|
Thu, May 23 |
|||||
|
08:30 |
Initial Jobless Claims |
w/e |
K |
346 |
360 |
|
08:58 |
Markit Manufacturing PMI |
Mar |
% |
52.0 |
52.1 |
|
09:00 |
Monthly Home Price mm |
Mar |
% |
0.9 |
0.7 |
|
10:00 |
New home sales-units mm |
Apr |
ml |
0.425 |
0.417 |
|
13:00 |
10yr TIPS Auction |
-- |
-- |
-- |
-- |
|
Fri, May 24 |
|||||
|
08:30 |
Durables Goods Orders |
Apr |
% |
1.6 |
-6.9 |
|
* mm: monthly | yy: annual | qq: quarterly | "w/e" in "period" column indicates a weekly report * Q1: First Quarter | Adv: Advance Release | Pre: Preliminary Release | Fin: Final Release * (n)SA: (non) Seasonally Adjusted * PMI: "Purchasing Managers Index" |
|||||


