At the risk of disappointing some the audience, let's skip the Top Gun shtick and focus on the danger zone that bond markets have been approaching this week. First of all--and as is frequently the case, despite this being "MBS" commentary--all three charts focus on Treasuries. The reason is the same: when we're considering thematic shifts in momentum, 10 yr Treasuries continue to be America's sweetheart. Add to that the fact that MBS price charts are grossly distorted this time of the the month due to 'the roll' (which left Fannie 3.0s at 103-21 last night) and the choice is clear for today.
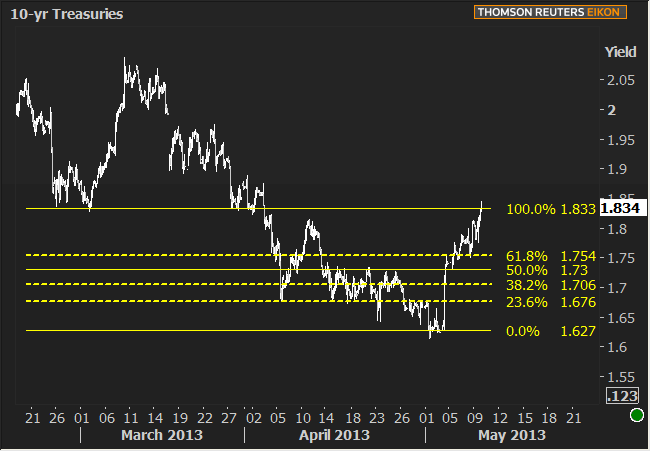
First up, here's hourly 10's including 2013 highs and lows (it's a 24 hour chart so we're getting Asian/European trading hours in here... it may look different than other charts set to domestic trading hours). The thematic consideration here is that of waxing-on and waxing-off of April's break below 1.84. You'll see in the third chart that 1.84 (or thereabouts) is quite the long term horizontal pivot point. The retracement lines are included just for kicks, but it is interesting to consider how regular the floor and ceiling tests were of the 50% and 23% lines during April and how the first move after May NFP made sure to wipe out all of that delightfully supportive sub 1.73 trading over the past 3 weeks.

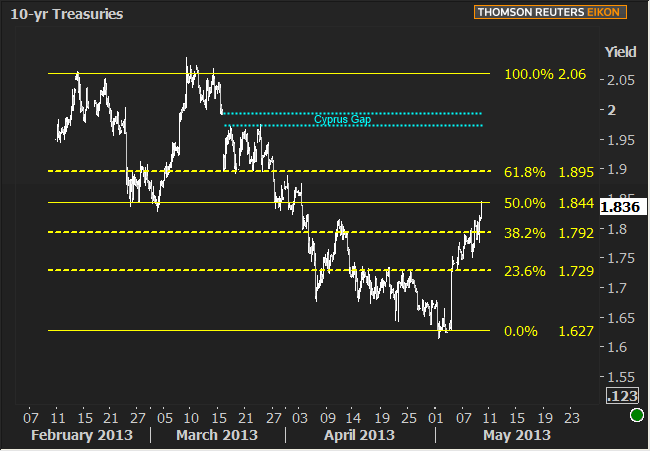
Here's another way of looking at the same phenomenon, but one that entertains future possibilities both above and below current levels. Again we have the 1.73 level in play and straining credulity just slightly, we'd consider 1.844 to be in the same family as 1.833 from the previous chart (you'll see why momentarily), but in this case, it's merely the mid-point of a broader potential correction--one that suggests the next battle around 1.90, with uglier possibilities as high as 2.06, but not before running into the "Cyprus Gap."

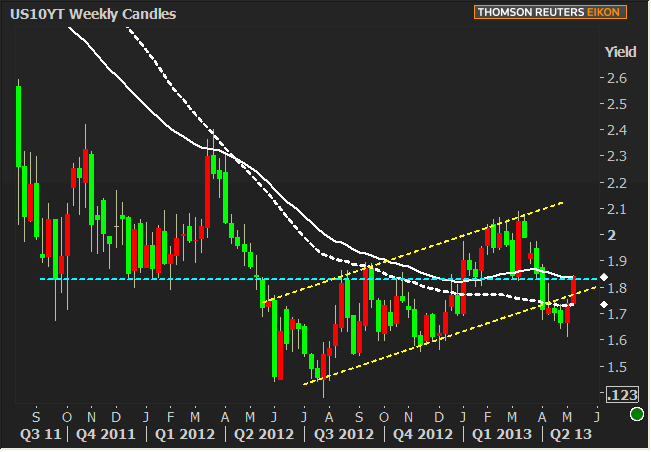
Now for the longer term chart. this one is WEEKLY candles (red=moving up, green=moving down). First, let's clear up all the conversation about 1.83/84 above. This is the teal line below. It could be 1.83 or 1.84, or even 1.826! The point is that when we're considering long term inflection points, there won't always be one perfect, obvious line in the sand that markets agree upon to the thousandth of a percent. Things that are that obvious and clearcut tend to break markets. There is no 2+2 = 4 here.... More like "roughly half + something that is around a half more than 95% of the time, stands a good change to equal "the whole," plus or minus some overrun in either direction."
1.84 fuzziness aside, this chart is fairly ominous. The white lines are the simple and exponential variants of 52-week moving averages. Both are valid lines in the sense that they exhibit better-than-random behavior as floors and ceilings. One of them suggests we just broke back above trend. The other suggests that we're testing a break of the trend today and next week (in that the right-most red candle is just now touching the solid white line).
Finally, note the parallel yellow lines forming a trend channel that began on in may 2012. Until April 2013, this trend had been a remarkably consistent "counterattack" vs. the all time lows in 10yr yields. Sometimes a charted security will depart a trend like this one only to return shortly thereafter. Sometimes the return ends up meaning nothing. Given the current yield levels, we wouldn't necessarily assume that we've returned to this uptrend, but this look back into the past performance of these technical indicators does give us something to assess the road ahead. There is no scheduled data today and markets will be "trading it out"--taking their cues from each other and the charts rather than any significant scheduled data.

|
Week Of Mon, May 6 2013 - Fri, May 10 2013 |
|||||
|
Time |
Event |
Period |
Unit |
Forecast |
Prior |
|
Mon, May 6 |
|||||
|
Tue, May 7 |
|||||
|
13:00 |
3-Yr Note Auction |
-- |
bl |
32.0 |
-- |
|
15:00 |
Consumer credit |
Mar |
bl |
15.00 |
18.14 |
|
Wed, May 8 |
|||||
|
07:00 |
Mortgage market index |
w/e |
-- |
-- |
883.8 |
|
07:00 |
Mortgage refinance index |
w/e |
-- |
-- |
4829.4 |
|
13:00 |
10yr Treasury Auction |
-- |
bl |
24.0 |
-- |
|
Thu, May 9 |
|||||
|
08:30 |
Initial Jobless Claims |
w/e |
k |
335 |
324 |
|
10:00 |
Wholesale Inventories/sales |
Mar |
% |
.3/.1 |
-.3/+1.7 |
|
13:00 |
30-Yr Treasury auction |
-- |
bl |
16.0 |
-- |
|
Fri, May 10 |
|||||
|
14:00 |
Federal budget, $ |
Apr |
bl |
85.5 |
-107.0 |
|
* mm: monthly | yy: annual | qq: quarterly | "w/e" in "period" column indicates a weekly report * Q1: First Quarter | Adv: Advance Release | Pre: Preliminary Release | Fin: Final Release * (n)SA: (non) Seasonally Adjusted * PMI: "Purchasing Managers Index" |
|||||


