Short covering has played a pivotal role in the surprisingly strong rates rally we've enjoyed over the past 5 sessions.
"Short covering" is when a bearish trader closes a position that was opened with the intention of capitalizing on lower prices/higher yields. The term "short" describes the trader's directional bias. "Covering" simply means closing the position. The resulting effect of short covering is a contraction in "open interest", which represents the number of open contracts in the marketplace. If a trader has set a short position and prices continue to rise, then their position is losing money. Leaving a short position open as rates continue to rally can be extra dangerous because the position gets more expensive to close with every uptick in price. So it should make sense that as rates have continued to rally over the past 5 session, it has forced more short covering which has led to snowball buying in the bond market.Call it bearish investors waving their white flag.
Plain and Simple: A positional imbalance has helped fuel this interest rate rally. Those positions have been balancing out over the past few days which makes sense because, as of last Tuesday, primary dealers were as short as they've been since November 9, 2010. This behavior isn't bullish outright though, we need to see real money buyers "waving in" new long positions to feel more comfortable about the "snowballing".
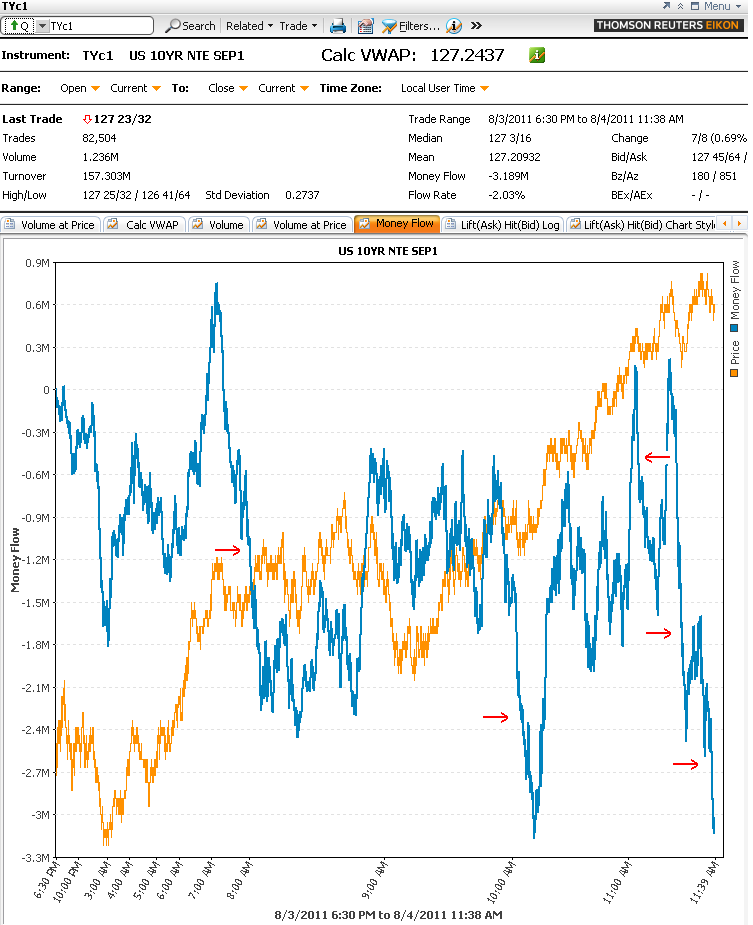
The money flow chart below illustrates short covering. When money is flowing out of the market and prices are rising, it indicates traders are closing short positions by purchasing back the contract they sold short. When this happens in high-volume and money flows are choppy it tells us there is more than just short covering going on, it means investors are opening new long positions too. This is supportive of the ongoing rally...
To oversimplify, short covering is where the price line goes up and the money flow line goes down.
Another reason for the rates rally, stocks have just completed a bearish "head and shoulders" reversal pattern. The confirmation of this formation implies there is room to run lower in equities. We have a soft spot in our hearts for 1220 because it's where the stock rally lost steam in late April 2010. Keep that level on your mind as key support. Fibonacci retracements suggest the S&P must venture down toward a test of 1,197 before all out capitulation occurs. This would represent a 50% retracement of new record S&P highs. In cash, the 200 day moving average is found at 1286. A short-covering rally or dead cat bounce would find it difficult to push-through this resistance. A break of 1286 in strong volume would be bullish for stocks. TECHNICAL EXPLANATION OF HEAD AND SHOULDERS & TECHNICAL EXPLANATION OF FIBONACCI RETRACEMENTS
Needless to say, continued selling in stocks would push interest rates even lower...

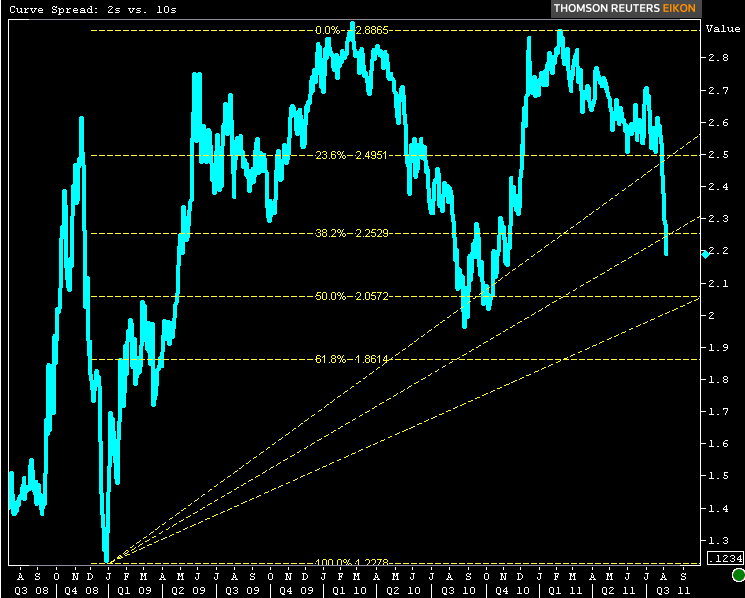
A bull flattening yield curve has been a major positive influence for mortgage rates too. The yield spread between the 2yr TSY note and the 10yr TSY note has tightened up 50bps since July 1st. That is massive pancaking! Continued spread tightening (bull flattening) would continue to pressure mortgage rates lower. Our next target is 205bps wide...
HOW DOES THE SHAPE OF THE YIELD CURVE IMPACT MORTGAGE RATES?
Here's where things get a little complicated. When the yield curve bull flattens and pushes longer-dated interest rates lower and "rate sheet influential" MBS prices higher. If production MBS coupon prices go up and stay up, mortgage rates will move lower as lock desks adjust their hedging strategies, increasing the incentive to refinance. When borrowers refinance they are paying off their current mortgage and getting a new one with a lower interest rate, which restarts the securitization process. That's great for borrowers but the bank, money market manager, pension fund, insurance company, hedge fund, or servicer that invested in the pool of MBS that contains that loan then loses the cash flows contributed by the borrower to that pool when they make their monthly payment (because they prepaid/paid off the loan early). This is the big difference between mortgages and other types of non-callable bonds like the 10yr Treasury note....an MBS investor knows about how much cash flow they will receive and when they will receive it, what they don't know is how long the cash flow will last due to the fact that borrowers have the ability to refinance their loan at any time (when they have incentive or need). This additional risk associated with mortgages is called prepayment risk, the option to refinance is an "embedded call option" within the mortgage-backed security. Prepayment risk adds a feeling of uncertainty, it distorts a portfolio manager's ability to determine the present value of the expected future income streams generated from pools of mortgages, especially when interest rate volatility increases.
Plain and Simple: When the yield curve bull flattens, as it has recently, the market is telling us it thinks interest rates will be lower in the future. When that happens, prepayment risk goes up and MBS coupons that are backed by loans with higher rates lose value (because lower rates = more incentive to refinance = more early MBS payoffs = loss of investor cash-flows). MBS investors must therefore find a way to replace that loss of expected income. To do that MBS investors sell a portion of their higher interest rate (fuller) MBS portfolio and buy lower rate MBS pools. This compensates for lost income aka extends the expected duration of their cash flows. We call this a shift "down in coupon".
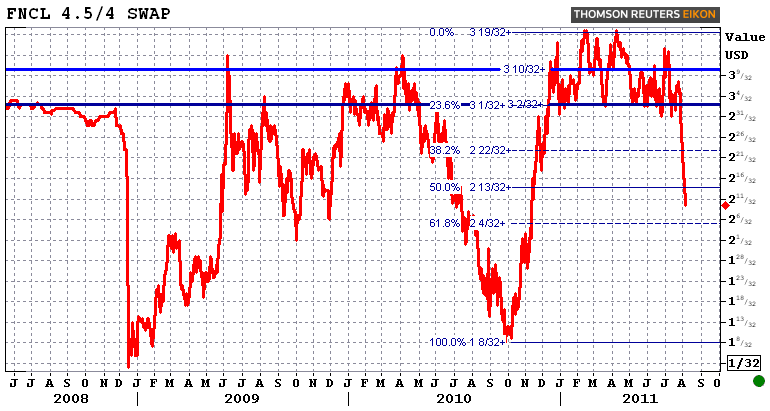
To illustrate "down in coupon" price action in the TBA MBS market, the chart below is the price spread between conventional production MBS coupons, the Fannie Mae 4.0 and the Fannie Mae 4.5. When the spread between the two is contracting it implies the FN 4.0 price is outperforming the FN 4.5 price. This is what we call a shift "down in coupon" aka MBS curve flattening. This is a big deal as it allows lock desks to swap out their 4.5 MBS coupon hedges for the better performing, less prepayment sensitive 4.0 coupons. As you can tell by your rate sheets, this observation is already reflected in loan pricing as 4.25 to 4.50 pricing is 150 to 200bps better over the past 5 sessions. I'd like to show you the FN 4.0/3.5 coupon swap because it's even more stunning than the FN4.5/4 swap, but I don't want anyone to misinterpret that to mean the FN 3.5 is now the official "production coupon title belt holder. We need to confirm this rally and the market needs to stabilize before we see 3.5s as the production coupon and 3.875% over par on rate sheets again.
Last night we illustrated how short covering, stock selling, and bull flattening has affected the benchmark 10yr note and FNCL 4.0 MBS prices in this post: Bond Market Officially Repeats History. Reality Restored. If you haven't read it, we recommend you do as it explains how we got here and shares some insight on what to expect in the months ahead. Based on that outlook we do think rates could go lower from here, but do we think it's worth floating overnight into the Employment Situation Report tomorrow? NO, especially if you've been waiting to recover from the QEII duration shedding debacle that played out in early November 2010. Do we think rates are going to spike higher in the long-term. No we do not. Read last night's post. It explains why....


