What is Fibonacci retracement? Where do the ratios come from? Why do they matter?
FROM: Investopedia FAQs
Fibonacci retracement is a very popular tool among technical traders and is based on the key numbers identified by mathematician Leonardo Fibonacci in the thirteenth century. However, Fibonacci's sequence of numbers is not as important as the mathematical relationships, expressed as ratios, between the numbers in the series.
In technical analysis, Fibonacci retracement is created by taking two extreme points (usually a major peak and trough) on a chart and dividing the vertical distance by the key Fibonacci ratios of 23.6%, 38.2%, 50%, 61.8% and 100%. Once these levels are identified, horizontal lines are drawn and used to identify possible support and resistance levels. Before we can understand why these ratios were chosen, we need to have a better understanding of the Fibonacci number series. (For a more in-depth discussion of this subject, see Fibonacci And The Golden Ratio.)
The Fibonacci sequence of numbers is as follows: 0, 1, 1, 2, 3, 5, 8, 13, 21, 34, 55, 89, 144, etc. Each term in this sequence is simply the sum of the two preceding terms and sequence continues infinitely. One of the remarkable characteristics of this numerical sequence is that each number is approximately 1.618 times greater than the preceding number. This common relationship between every number in the series is the foundation of the common ratios used in retracement studies.
The key Fibonacci ratio of 61.8% - also referred to as "the golden ratio" or "the golden mean" - is found by dividing one number in the series by the number that follows it. For example: 8/13 = 0.6153, and 55/89 = 0.6179.
The 38.2% ratio is found by dividing one number in the series by the number that is found two places to the right. For example: 55/144 = 0.3819.
The 23.6% ratio is found by dividing one number in the series by the number that is three places to the right. For example: 8/34 = 0.2352.
For reasons that are unclear, these ratios seem to play an important role in the stock market, just as they do in nature, and can be used to determine critical points that cause an asset's price to reverse. The direction of the prior trend is likely to continue once the price of the asset has retraced to one of the ratios listed above.
Check out the chart below. It's the Fannie Mae 30yr 4.0 MBS coupon. Notice how prices seem to gravitate towards and change direction near Fibonacci support and resistance levels. Holding above 100-00 is a short-term goal. Breaking and holding 100-18 (23.6% retracement) is post-jobs data objective (10-20 days). On the flip side, the floor falls out under 4.0s once 99-01 support is breached (62% retracement). That's where we'd expect to see "duration shedding" aka snowball selling.
100-00 = THE MIDDLE
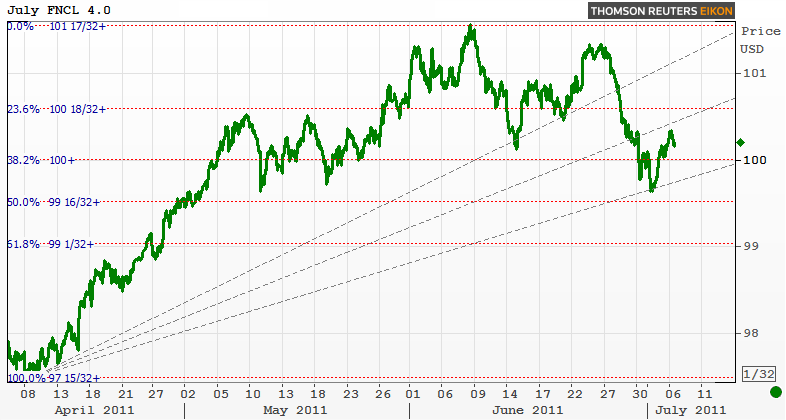
Chart first used in Bonds Get Crushed as Stocks Take Desperate Measures on June 14: ".... I've overlaid one of my favorite studies: Fibonacci Retracements. As you can see, the FNCL 4.0 has found support at a key technical level. Valuations are very attractive as yield spreads are just off year to date wides....but we're still playing follow the leader with benchmarks. If TSYs weaken further, so will mortgage pricing."
MBS traders are stuck in an awkward spot here. Yield spreads have tightened up significantly over the past few days, so bargain buyers are acting less aggressively and sellers are nervous about richer valuations (profits). There is also a quantitative ledge present that is preventing investors from taking a long-term stance. That makes mortgage rates most sensitive to the directional movements of benchmark Treasuries and the broader markets. Still.
We need to see 4.0s keep their head above water (100-00) to limit "duration shedding" and hedge ratio extension. The market is "waiting for guidance". . MBS TRADERS: STAY NIMBLE BE READY FOR ANYTHING
READ MORE: "Risk Off": MBS Buyers Missing in Action


