Not only was today quiet in terms of trading volume, but there wasn't much directionality in charts either. Ranges were narrow and only tightened as the day progressed. Short covering was once again the main culprit behind lower TSY yields.
Here are a few charts.....
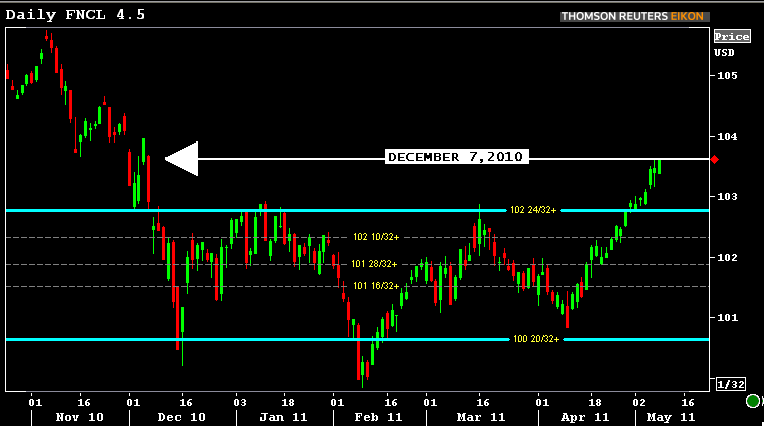
The FNCL 4.5 is currently visiting levels not seen since December 7th 2010. FNCL 4.5s remain the production coupon of choice for loan pipeline hedgers because a shift "Down in Coupon" is still in its infant stages. It seems like real money accounts are taking the "Cheapest to Deliver" route and managing duration gaps with mtg options contracts (CMM/CMS) while fast$ money managers are dabbling in the convexity coupons like 4.0s and 3.5s.
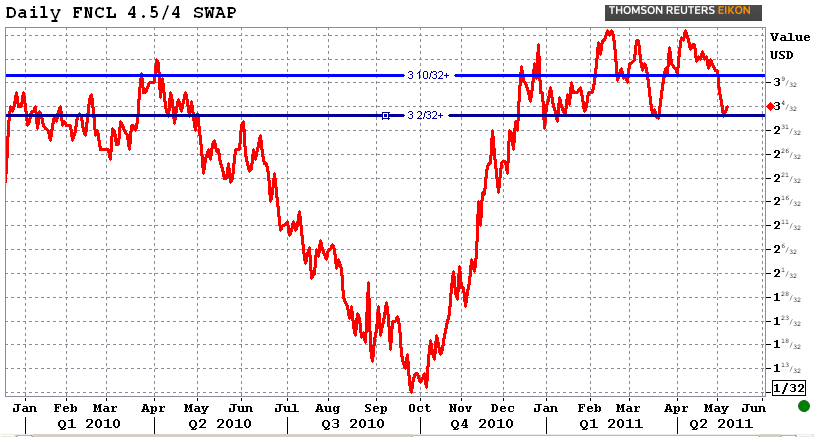
The FNCL 4.5/4 coupon swap is a gauge of positive progress when it comes to the willingness of loan pipeline hedgers to move "Down in Coupon". I'd look for increased 4.0 MBS loan sales (lock desk hedging) as the 4.5/4 intercoupon swap approaches 280bps wide. Currently the FNCL 4.5/4 swap is hovering around long-standing resistance at 312bps.
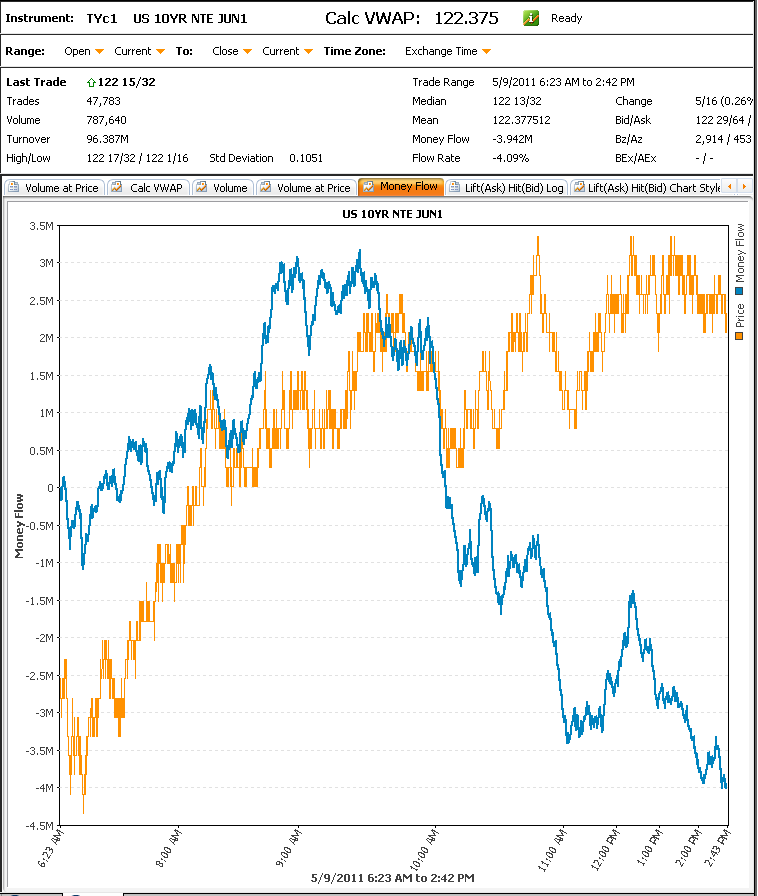
The chart below illustrates money flows in the 10-yr TSY futures contract. When prices go up and money flow goes down, price action is indicative of short covering.
Short covering has played a pivotal role in the ongoing rates rally. "Short covering" is when a bearish trader closes a position that was opened with the intention of capitalizing on lower prices/higher yields. The term "short" describes the trader's directional bias. "Covering" simply means closing the position. The resulting effect of short covering is a contraction in "open interest", which represents the number of open contracts in the marketplace. If a trader has set a short position and prices continue to rise, then their position is considered to be under water or "in the red". Leaving a short position open as rates continue to rally can be dangerous because the position gets more expensive with every uptick in price. So it should make sense that as rates have continued to rally it has forced more short covering which has led to snowballing in the bond market. Forced short covering is a sign of investors waving the white flag on their bearish positions but it doesn't mean there is more rally to come. This behavior is encouraging, especially when done so in mass, but it must be intensified by real money investors (as opposed to fast$) who need to move their funds "down in coupon". It must also be backed by a CONFIRMATION of weaker economic fundamentals and shorter hedge ratios....
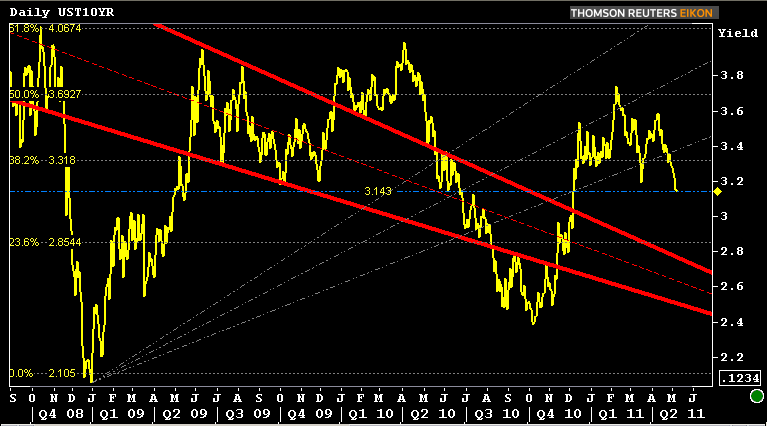
Below is an updated version of our long term 10yr TSY note yield chart. I took the liberty of drawing a horizontal line at current levels to illustrate the market's past behavior in a similar environment. As you can see 3.14% has several steep drops and gains surrounding it. This reflects the duration adjustments required to be made by fixed income cash-flow managers as yields travel through this inflection level.
The combination of economic data, Fed-Speak, and a round of Treasury Auctions should be enough to shake things up a bit tomorrow. In fact, each of the next 3 days contains all three of those participants, with Friday containing only econ data.
Tomorrow kicks off with some early 730am data in the form of the NFIB Small Business Optimism Index. In and of itself, it's not much of a market mover, but it can add momentum if combined with similarly bearish or bullish ingredients that were mixed in during the overnight session. Import Prices hit at 830am followed by Wholesale Trade at 10am. That'll do it for econ data. Fed Speakers include Duke at 930am and Lacker at 1245pm. Finally, 1pm brings what has the potential to be the biggest mover of the day: the 3yr TSY auction.


