I posted this alert a few minutes ago....
After failing to breach 2.46% resistance yesterday, the 10 year TSY note is experiencing profit taking following a stale overnight trading session and better than expected jobless claims data. "Rate sheet influential" MBS are seeing similar behavior. A general lack of liquidity combined with follow through selling has led production MBS coupon prices to the lows of the day.The potential for reprices is rising. I wouldn't panic just yet though. The range should contain further selling....
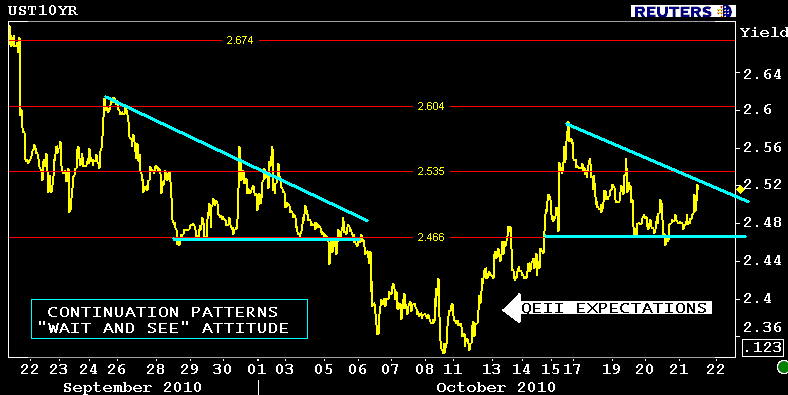
The chart below illustrates what I meant by "the range should contain further selling". Notice 10s are repeating history. The short-term continuation/consolidation pattern (blue) is very similar to the 10yr note's behavior in late September/early October.
10s have chopped around in a consolidative manner since yields shot higher last week after three poorly attended Treasury auctions left dealers loaded up with excess duration inventory. Since then 2.46% has proven to be a clear line of QEII demarcation, as in 10s are unlikely to close below 2.46% until investors hear new supportive details on the status, style, and timing of QEII. 10s should continue to consolidate around 2.46% before eventually trading through resistance and breaking out to lower yields. Of course this assumes the necessary QEII catalysts will be provided by the FOMC on November 3.
In the meantime, the blue continuation pattern ie expected to provide directional guidance on a day over day basis. Once short term profits are squeezed out by the street (when the blue lines meet again), expect 10s to release stored energy and move higher where the continuation pattern will start all over again.
In terms of the potential for intraday ups and downs, if liquidity dries up and sellers are unable to find willing buyers, the red lines are support levels, where buying interest should pick up. 2.60% is max-support...aka where I would expect to see a recovery. 2.54% is intra-day support today.
Plain and Simple: 10s should trade between 2.60% and 2.46% until more QEII details are provided. If you are thinking of locking in the next week, 2.46% is your "Play the Range" lock signal.
As explained this morning in the "Day Ahead" post, rate sheet influential MBS have recently benefited from a supportive supply/demand environment in the TBA marketplace. Those favorable conditions dried up today as profit takers are...er...taking profits (UIC positions mostly) and loan originators are hedging their pipelines by selling loan supply forward (at the perceived price highs). This relative cheapening was much needed...
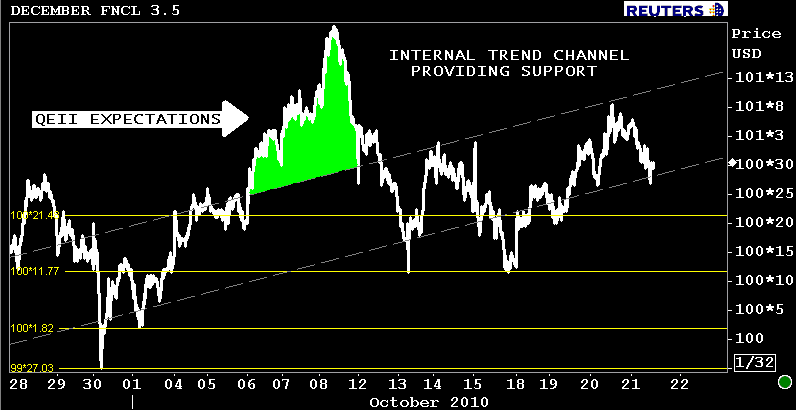
From a technicians perspective (previous price history), the FNCL 3.5 is biding its time by bouncing back and forth between two internal trendlines minus the occasional exit from QEII sugar-high heaven. The highlighted green portion of the chart reflects where the FNCL 3.5 is expected to trade in the event QEII comes true.
The December FNCL 3.5 is currently -0-09 at 100-28. The December FNCL 4.0 is -0-06 at 103-06. Yield spreads are wider after an increase in originator hedging and uptick in vol.
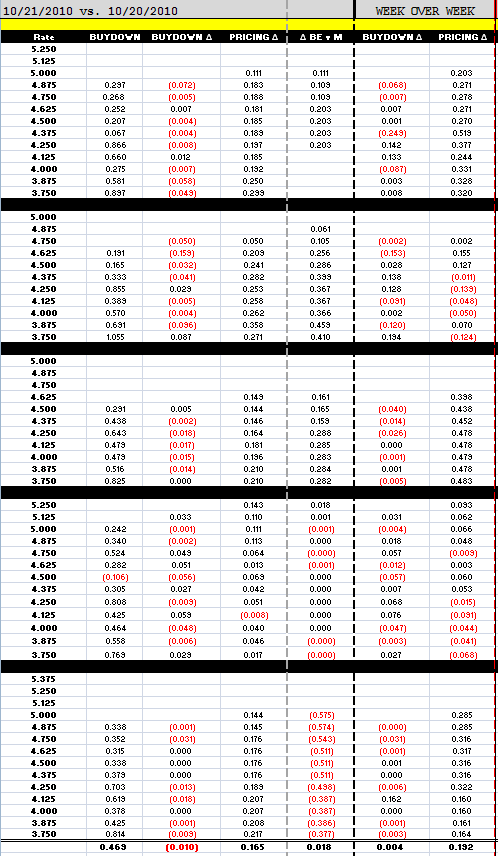
Reprices for the worse have been reported. Loan pricing was 16.5bps better on average before lender recalls started hitting inboxes. Those rebate improvements will be erased when rate sheets are re-released.
The terms of Treasury auctions to be held next week have been published.....
$109 billion will be offered as follows:
- OCT 25: $10 BLN REOPENED 5-YR INFLATION-INDEXED NOTES TO SETTLE OCT 29
- OCT 26: $35 BLN 2-YR NOTES TO SETTLE NOV 1 ($1bn less than previous auction)
- OCT 27: $35 BLN 5-YR TO SETTLE NOV 1 (UNCH from previous auction)
- OCT 28: $29 BLN 7-YR TO SETTLE NOV 1 (UNCH from previous auction)


