The FN 4.0 ended the day +0-07 at 98-21+ yielding 4.140% while the FN 4.5 went out +0-08 at 101-05 yielding 4.3598%. The secondary market current coupon is 4.249%.
Rate sheet influential MBS coupons were outperformed today by benchmarks as MBS Current Coupon yield spreads ended the day wider (MBS yields rose more than TSYs and swaps). Here is a breakdown of relative value: CC yield is 91 basis points over the 10 yr TSY yield. CC yield is 196.3 basis points over the 5 yr TSY yield. CC yield is 74.5 basis points over the 10yr swap rate.
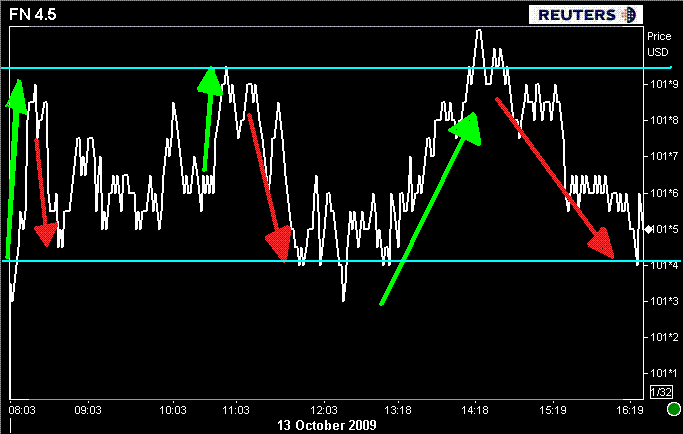
Here is an intraday chart of the FN 4.5's price action....
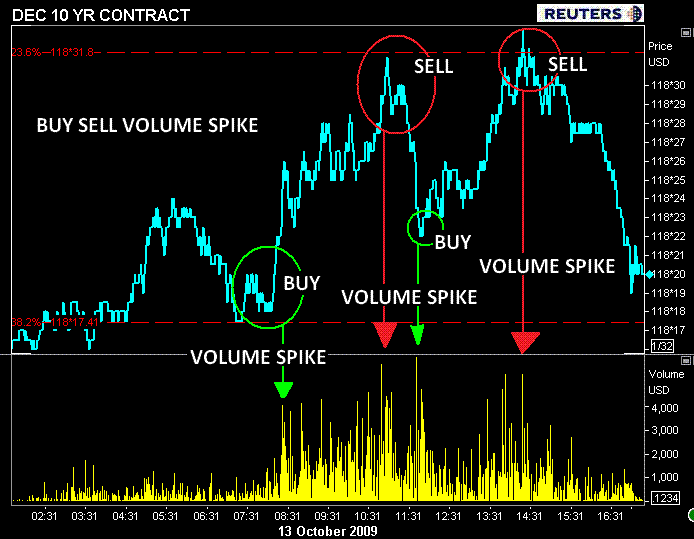
The idea of short term range trading was obvious in the rates market today. Below is a chart of the December 10yr TSY futures contract. Notice how trading volume spiked as prices approached support and buyers jumped into the market. However as the rally developed and long term resistance levels were run into, selling volume took over and prices fell. Then, as positions were adjusted, another round of buying/accumulation took place which pushed prices back towards resistance...which in turn brought out profit takers. The extra sell off at the end of the day can be blamed on INTEL earnings. Notice how volume increased at each test of resistance and support which resulted in a reversal of price direction...and ultimately a RANGE BOUND trading session.
Over the summer we coined a new term based on the bouncy price action occurring in financial markets: CHOPATILITY
The lack of meaningful market direction we dealt with on a daily basis often led to frustrated outcries from originators and borrowers who were waiting for a range breakout that might lead mortgage rates lower. However, at some point along the way we noticed many were beginning to accept the range and actually using it to profit on their pipeline. Remember the saying lock at the high side of the range, float at the bottom?
The ridiculousness of the range reached a peak when we were all able to predict price action before the trading session even got underway. Economic data was being ignored, Treasury supply wasn't breaking the sideways price action, even another leg up in the equity rally couldn't kill the predictability of pivot points.
And then, in late September, we experienced the range breakout everyone had been waiting for....the 10yr TSY note fell to a low of 3.18% (intraday we tested 3.10%) and mortgage rates touched 4.50% for the first time since late spring. A long wait was over...BLACK WEDNESDAY fence sitters leaped from their perches and files that had a thick layer of dust were bumped to the front of your stand ups.
Unfortunately the range breakout didn't last long. In the past three trading sessions, benchmark yields have returned to the range were grew so accustomed to watching towards the end of the summer/early fall. The breakout was erased as quickly as it was broken.

Now are left asking ourselves those same BIG PICTURE questions we posed all summer....
- Has the economy REALLY stabilized?
- Has the trend of improved econ data been a function of government stimulus spending and lax monetary policy?
- Has a run up in equities distorted perceptions of economic reality?
- Can the consumer lead or even be a part of the recovery process while the labor market is still contracting?
- Will the Fed raise rates while the labor market is contracting?
- How much are economists relying on home equity to contribute to consumer demand?
- Can the mortgage market support the assumptions economists are making about home equity?
(Many economists assume that rising home values will reduce stress and allow for more spending. Mortgage industry professionals already know home equity, if there is any at all, is almost impossible to access unless the borrower has flawless credit (better not have lates on your credit card either), so we dont feel the need to harp on that assumption.)
From where we stand, while the Fed's exit strategy is a short term focus of many fixed income trading strategies, the health of consumer balance sheets is at the core of the BIG PICTURE recovery debate. Many market participants believe the economy can recover without robust demand from the consumer as cost cutting measures and increased productivity are expected to keep company cash flows positive. While many are basing their trades on that assumption, others are gladly making a market for them in hopes they are wrong.
The days ahead will present several opportunities for traders to "put their money where their mouth is" regarding their BIG PICTURE recovery assumptions. The health of household balance sheets will be on display for the rest of the week starting tomorrow when the Department of Commerce releases Retail Sales Data at 08:30AM. While import prices and business inventories are also on the calendar, September Retail Sales data is likely to attract the attention of money movers...and therefore have the most impact on financial markets.
If you recall, August Retail Sales greatly benefited from the Cash for Clunkers program. Given the slow down in car sales in September, we are more interested in "ex-auto" data as it should provide a clearer view into consumer spending habits and the actual health of household balance sheets. In August, the ex-Autos portion of Retail Sales posted a sizeable 1.1% gain. Although this reflected an increase in gasoline prices, overall, retail sales were surprisingly better than expected as almost all categories improved after a 0.5% decline in July (ex-autos). READ THE MND STORY for a full breakdown of the data.
At 2:15 the Federal Reserve will release the minutes of the Sept.23 FOMC meeting. As pointed out above, the Fed's discussion regarding their exit from 0.00% rate policy is a favorite topic among fast money rates traders, therefore most market participants will be focused on the metrics that will affect the Fed's monetary policy outlook: the labor market and inflation. If the the Fed hints that rate hikes may occur before the labor market stops contracting...the short end of the yield curve will suffer, and the long will likely not fair well as spreads across the yield curve firm. I can go on and on about possible perspectives that could taken by the market...its a moot point though, just remember RATE HIKES=BAD, INFLATION=BAD. The more relevant concern arises because "rate sheet influential" MBS prices play "follow the leader" with benchmark big brother TSYs. If long term yields rise, so too will mortgage rates. We dont want to smell even the slightest hint of hyperinflation fears coming from the FOMC .
Plain and Simple: economic outlooks continue to be muddled with uncertainty and assumptions based on assumptions. In times of great economic unpredictability, the mentality of a trader is to set up their strategies based on day to day events while keeping a watchful eye on supply/demand technicals. When trader's are operating in this environment, market watchers often state that LOGIC appears to missing from post-data/post-event value adjustments (price reactions). It is important that one not get too caught up in the market's initial knee jerk reactions to fundamentals. Watching for longer term trends in data and market reactions is the proper way to discount future asset values. Remember: the market finds a way make as many people wrong as possible. Sometimes the trade follows the news, sometimes the news follows the trade. Whatever happens, dont let it distort your perception of economic reality.
I think the most important statement I can make to you is: ALWAYS GUTFLOP. Never float your entire pipeline. Remember the saying lock at the high side of the range, float at the bottom? We will continue to trade the range until the range breaks down.
PS...JP MORGAN RELEASES EARNINGS


