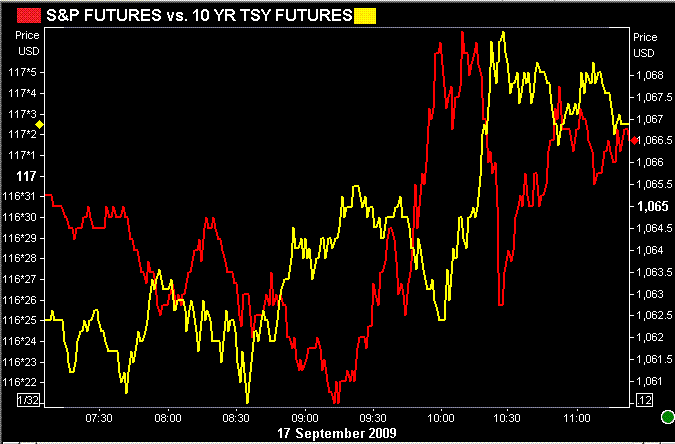
Trader's at the CME have reported a Paul Bunyan sighting. Eye witnesses note Buynan's insatiable urge to chop and hack at anything in sight..including interest rate and stock futures contracts. Bunyan was first spotted after 830AM data, then he disappeared for a bit before making another appearance following the release of Philly Fed data at 10AM, and then once again just before the Treasury Department announced the terms of next week's auctions. For a brief moment equity traders went into a panic after onlookers confused Buynan's side kick, Babe the Blue Ox, with a sick bull. It is unclear whether or not the legendary lumberjack will make another pass though the pit, trader's are however prepared for the possibility of more price chopatility.
Here is an artist's rendering of the aftermath of Buynan's visit to the CME...
HAHA...is it sad that im sitting alone in my office...laughing out loud?
I think you may have figured out my point though....its been a choppy morning!
After the release of 830 housing and jobs data, both stocks and bonds rallied. The S&P made yet another 2009 price high while the 10 yr note fell as low as 3.44% before testing 3.50% support ahead of 10AM data. When the Philly Fed Index was released at 10AM....which was WAY better than expected...the 10 yr note fell from 3.50% to an intraday low of 3.42%. Upon reaching the bottom side of the recent range, rates began to tick higher ahead of the 11AM TSY auction announcement.
Choppity Chop Chop....
Here's how it played out in yield...
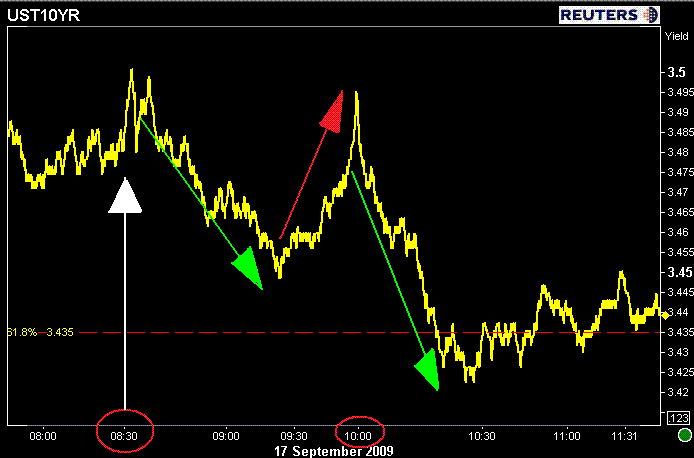
I circled 830AM and 10AM because that's when the majority of action took place. Look at this volume chart...
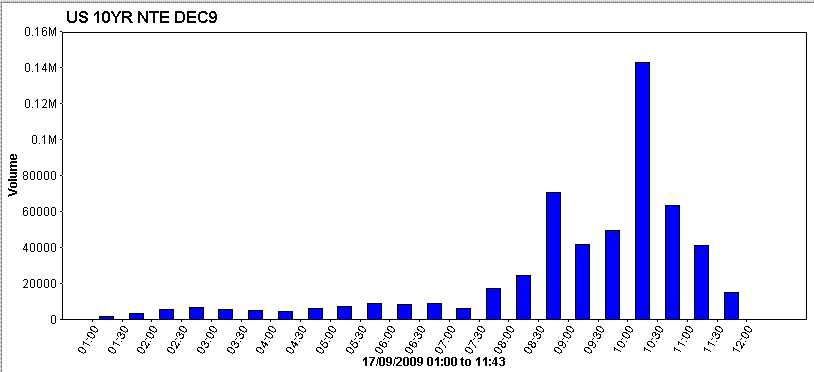
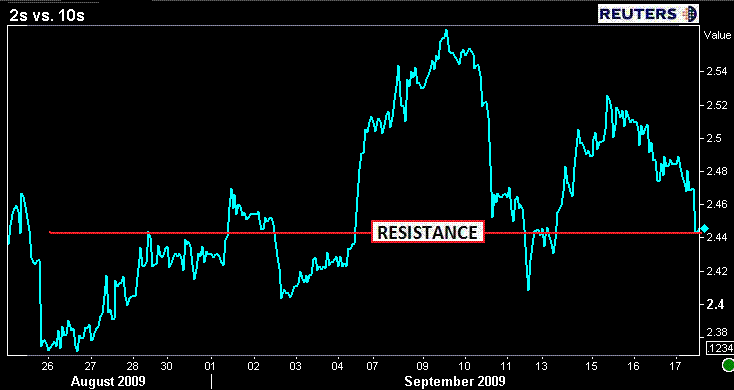
This chopping about reflects a demand for the long end of the yield curve, profit taking, and short covering after the Philly Fed data (explaining the irrational rally that followed WAY better than expected 10AM econ data). Trader's are doing exactly what they should be doing...day trading curve spreads. At the moment the bias is for a flatter curve...sell 2s buy 10s. Thus...the 2s/10s curve is flatter, testing resistance at 244bps. We do still have some room to flatten further but not much...that said the 10yr note could move as low as 3.42% but we anticipate trader's wont be willing to let profits sit on the table for long if prices move up on low volume. This is the range trade....between 3.42% (sell) and 3.50% (buy/cover).
AND LAST BUT NOT LEAST...the MBS market.
The secondary mortgage market is in cruise control...the Fed continues to provide 2x liquidity for any originator looking to sell, yield spreads are a little tighter (again), and day traders are meddling up in coupon. Same old story. Benchmark big brother TSYs are helping your cause though, leading "rate sheet influential" MBS prices higher in a choppy manner...
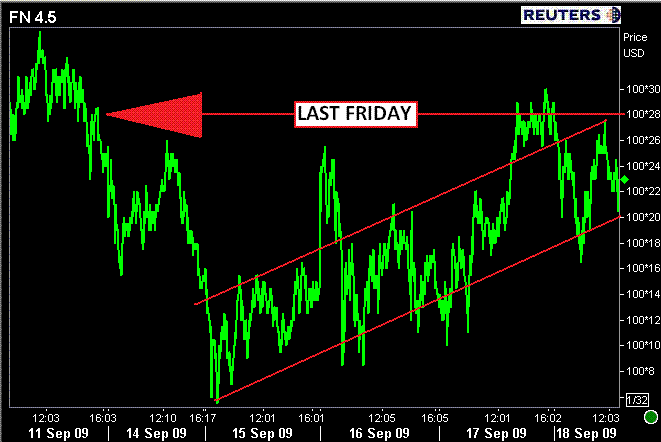
Given slight spread tightening and possible rally to 3.42% in 10s...100-23 looks to be a firm intraday price ceiling (spread over 10s = 99bps).
The point: the recently bearish bias of higher rates continues to be contained by the range. TSYs continue to perform well in the face of better than expected econ data and a relentlessly optimistic equity market. Bond yields illustrate participant's generally nervous long term economic outlook. Makes you think the stock market rally isn't built on a solid foundation doesnt it? (mutter mutter yeh its been built on momentum, not proper discounting of expected earnings.)
Next week the Treasury will auction $112bn 2s/5s/7s. All three issues increased by $1 billion: $43 bln 2s, $40 bln 5s and $29 bln 7s,which was in line with expectations.2s go off on Tuesday, 5s on Wednesday, 7s on Thursday.
Is equifax down?


