
In August, MND published a summary of an analysis of the current state of the adjustable rate mortgage (ARM). CoreLogic's senior professional economist, Archana Pradhan, wrote that while the product's best days are behind it, the near demise is probably only temporary. The ARM share of mortgages, which reached a peak of 45 percent in mid-2005 now fluctuates between 5 and 13 percent, rising and falling with interest rates. Even at that, it is a decent recovery from the low of 2 percent it reached in mid-2009.
ARMs are more common among homebuyers with large-balance loans, making up 47 percent of loans over $1 million that were originated in the first quarter of this year. Further Pradhan said, as rates increase, the ARM will undoubtedly rise again. Therefore, and especially given the role those loans played in the housing crisis, the risk they present is not without interest to those in the industry.
Her earlier article underlined the difference between today's ARMs and those from before the crash. Almost none are no- or low-documentation lows, almost all are conventional loans, and borrower credit scores are higher.
Pradhan has now concluded a second analysis. In a new article in the CoreLogic blog, she explores the actual default experience over time for ARMs and fixed-rate mortgages (FRMs.)
CoreLogic's Loan Performance Report for June 2017 put the overall serious delinquency rate at 1.9 percent, down 0.6 percentage point from a year earlier. Looking at ARMs and FRMs separately, the serious delinquency rates were 5.2 and 1.8 percent, respectively. The serious delinquency rate for each was down significantly on an annual basis and are near 10-year lows. Still, the rate for ARMs is almost three times higher than that of FRMs.
But those delinquency rates are still heavily influenced by pre-crash vintages. The bulk of serious delinquencies are among both ARMs and FRMs originated between 2003 and 2008. More than 90 percent of delinquent ARMs were originated in those years, compared to just 3 percent that were originated between 2010 and 2017. With FRMs, the respective numbers are 61 percent and 28 percent. Pradhan says the number of pre-2010 loans included makes the delinquency rate a misleading guide of how newer ARMs are performing relative to FRMs.
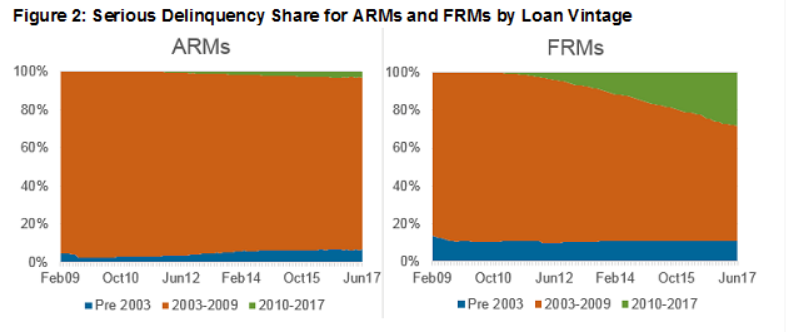
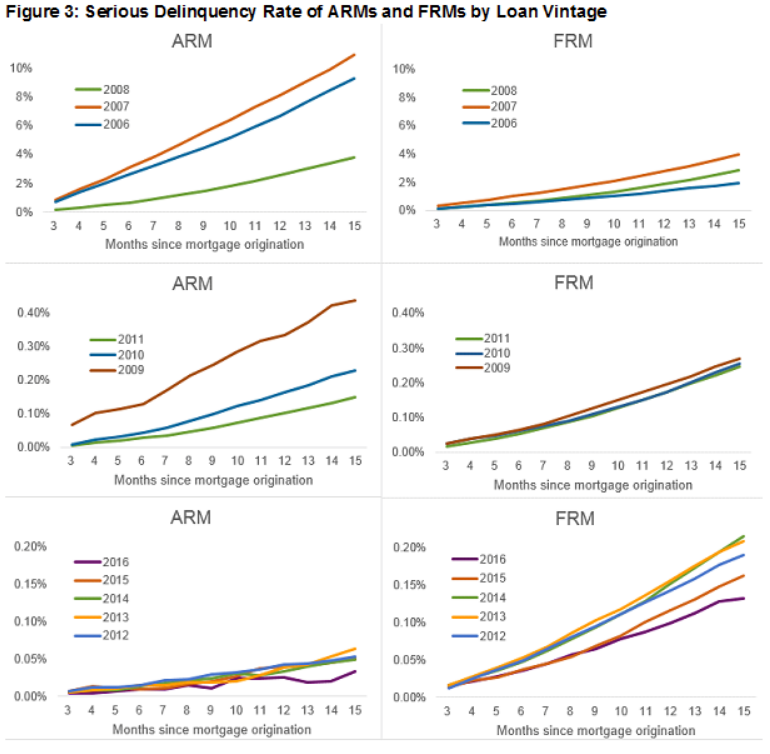
Figure 3 compares the serious delinquency pattern for the two types of loans by origination year. Each line in the figure represents the serious delinquency rate for all conventional loans from each year as they age. The author says such an analysis show three important trends.
- Not surprisingly, delinquency rates were higher for all loans originated between 2006 and 2008. Performance of both the ARMs and FRMs started to improve gradually beginning with the 2009 vintage as the underwriting standards tightened and the economic recovery began mid-2009.
- Loans originated in 2016 have performed the best, with the lowest 15-month delinquency rate in a decade.
- The delinquency rate for ARMs was higher than FRMs for loans originated before 2010, but the pattern was reversed beginning in 2010 as the riskiest ARM products, such as the option ARM and the interest-only ARM, largely vanished. The Ability-to-Repay and Qualified Mortgage (QM) standards have generally eliminated such risky products. The QM regulation requires ARMs be underwritten to the maximum interest rate that could be applied during the first five years of the loan, eliminated negative amortization, and set standards for computing the debt-to-income (DTI) ratio.
The delinquency rate was also compared across loans selected for different subsets such as loan-to-value ratio (LTV) buckets, loan purpose and property type. The results were similar to those shown in Figure 3, which the author says underscores that the performance of post-2009 originations, for both ARMs and FRMs, has been strong, and that recent vintage ARMs appear to have had even lower delinquency rates than FRMs.


