
To understand the top-line story in the Urban Institute's (UI's) latest Chartbook released on Monday one has to go back to another UI paper published more than a year ago. In the article the UI's Housing Policy Center's director, Laurie Goodman, and fellow researchers claimed that the share of first-time homebuyers was in reality much higher than other research, notably that of the National Association of Realtors® (NAR) had asserted.
NAR has consistently said that these homebuyers typically represent 40 percent of buyers in a healthy market and has reported the share as remaining below this mark since mid-2010. Indeed, for several years NAR has put the share at 30-32 percent and continued to do so in its latest existing home sales report released last week. Goodman and her team contended that the widely accepted measures of the percentage of first-time buyers such as those provided by NAR "are overbroad and sometimes misleading."
MND covered that analysis extensively when UI produced it, but as a brief recap, they said that until 2013 there was not a complete set of loan level data available for the largest body of mortgage loans. Second, NAR's percentage of first time buyers was based on a universe of sales that included those for all cash (which rose dramatically after the crash) and purchases of second homes and investment properties. The Institute focused on sales of primary residences purchased with a mortgage. Also, NAR bases its conclusions in part on a survey of buyers that has a very low response rate (equating to a final sample under 10,000) while the UI looked at 1.8 million mortgages.

In any case, the bottom line was that the UI study found first-time homebuyers in 2014 accounted for about 52 percent of home purchases while NAR put the share at around 32 percent.
This explanation was necessary into to explain the number Goodman uses in her current Chartbook analysis which concluded that it is the share of repeat homebuyers that is declining and that tight credit is responsible.
UI looked at GSE (Freddie Mac and Fannie Mae) and FHA loans which made up the majority of the mortgage market with the exception of 2004-2006. They found that, starting in about mid-2007, the share of first-time homebuyers was consistently between 50 and 60 percent whereas in earlier years, 2001 to 2007 the share was much lower, only 40 - 50 percent. They took a closer look to determine if the increasing first-time homebuyer shares since the housing crisis was a function of more first-time buyers or if the number of repeat buyers had fallen off.
They found that while there were the same number of first-time homebuyers in 2001 and 2015 - 1.3 million, there were about half as many repeat homebuyers in 2015, just over 9000, compared to 1.8 million in the earlier years.
The conclusion is that repeat homebuying took a big tumble and just kept falling after 2007. "And it's no coincidence that this happened at the same time it started to become really difficult to get a mortgage anywhere in the US and hard to build equity, thanks to dropping home prices."
Expect UI to expand further on this finding in upcoming months. Meanwhile, its Chartbook, which is a reprise of most housing data published during the preceding month, did have few new items MND had not previously covered.
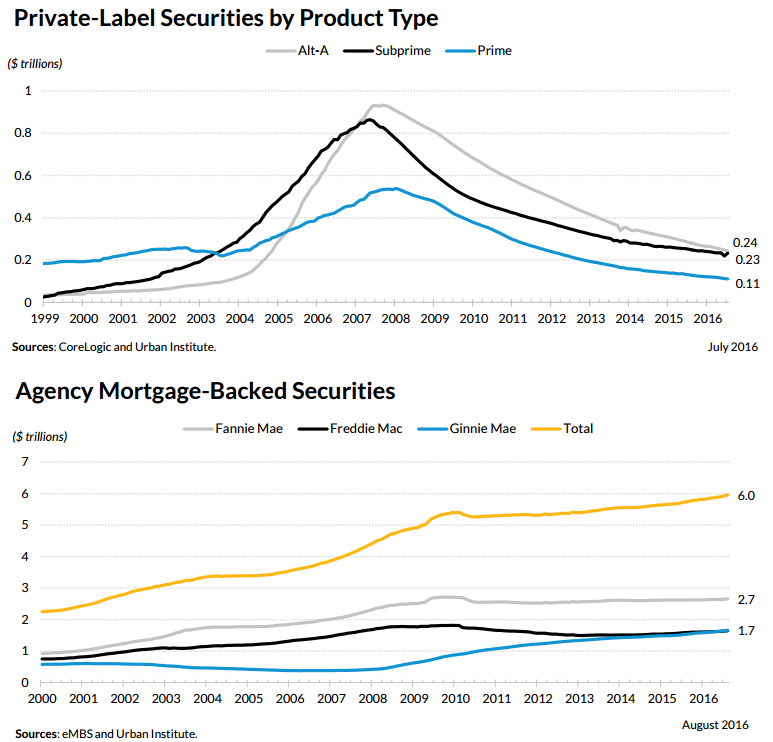
Private label securities still make up just a fraction of the market. July figures showed a private market of $587 billion while there was $5.96 trillion in outstanding securities in the agency market in August. Private label securities ran heavily toward non-prime loans. Alt-A loans had a 41.5 percent share; 39.6 percent were subprime with only 18.8 percent considered prime.
Among agency securities Fannie Mae remained by far the leader with $1.7 trillion or 44.6 percent of that market. Ginnie Mae had more outstanding securities than Freddie Mac for the fourth consecutive month; 29.9 to 27.6 percent.
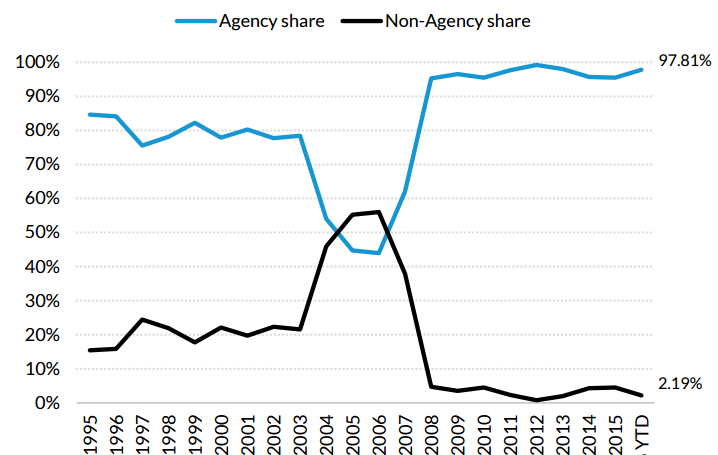
Securitization numbers in the first half of 2016 were similarly lopsided. The non-agency share of securitizations was 2.19 percent, even smaller than the percentages for all of 2014 and 2015, 4.3 percent and 4.5 percent respectively.
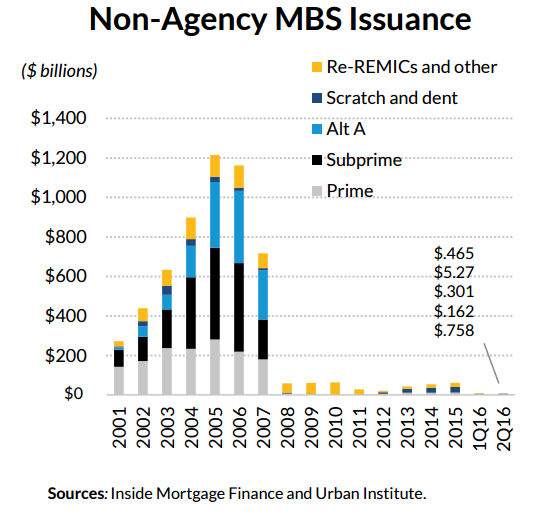
Moreover, of the limited securitization that is getting done, the bulk of the volume is what UI calls "scratch and dent" deals; non-performing and re-performing loans. The volume of prime securitizations in the second quarter of 2016 was $0.76 billion, down from $2.35 billion in the same quarter of 2015.
The conservatorship continues and the GSEs continue to shrink their portfolios as they are obligated to do under their preferred stock agreement with the U.S. Treasury. UI found they are shrinking their less liquid assets, that is mortgage loans and non-agency MBS, at close to the same pace as they are shrinking their entire portfolio.
In July Fannie Mae had a portfolio of $308.88 billion, down from about $800 billion in 2010-2011 and a 19.7 percent decline from July 2015. Its less liquid assets have declined by 12.6 percent.
Freddie Mac's portfolio has shrunk by 14.4 percent on an annual basis and its less liquid assets are down 21.5 percent. The current portfolio value is $319.26 billion compared to its 2009 peak of about $850 billion.
Each of the GSE's has a 2016 cap of $339.30 billion. Even though these figures represent only part of a year, both have already achieved their target reductions.


