
Indices released by two of the leading sources of home price information this morning confirm the continued growth of home values in the U.S., at least through July. While their methodologies differ and direct comparison is not possible, both showed substantial growth for the month. The Federal Housing Finance Agency (FHFA) said its House Price Index (HPI) rose 1.0 percent on a seasonally adjusted basis in July while S&P/Case-Shiller reported its 10-City Composite rose 1.9 percent and its 20-City Composite was up 1.8 percent.
However, while the Case-Shiller Indices indicate that growth may be slowing, both its indices rose 2.2 percent from May to June, the FHFA HPI showed month-over-month appreciation at the highest level since March. Case-Shiller reports that all 20 cities tracked by its two indices showed monthly gains for the fourth consecutive month, but like the two composites, 15 of the cities had smaller gains in July than in June.
On an annual basis the 10-City has gained 12.3 percent since July 2012 and the 20-City 12.4 percent and the deceleration in price gains was not as pronounced as in the monthly returns. Thirteen of the 20 cities had larger annual increases in July than in June.
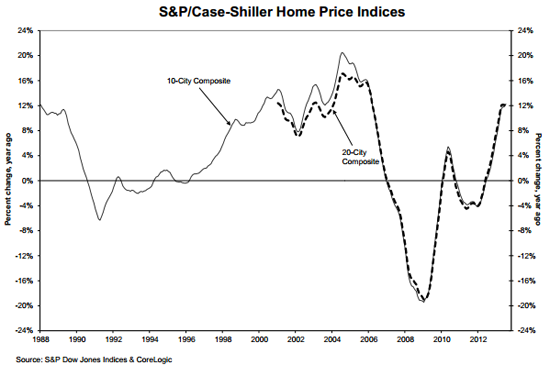
"Home prices gains are holding their 12% annual rate of gain established by the two Composite indices in April," says David M. Blitzer, Chairman of the Index Committee at S&P Dow Jones Indices. "The Southwest continues to lead the housing recovery. Las Vegas home prices are up 27.5 percent year-over-year; in California, San Francisco, Los Angeles and San Diego are up 24.8, 20.8, and 20.4 percent respectively. However, all remain far below their peak levels.
"Since April 2013, all 20 cities are up month to month; however, the monthly rates of price gains have declined. More cities are experiencing slow gains each month than the previous month, suggesting that the rate of increase may have peaked.
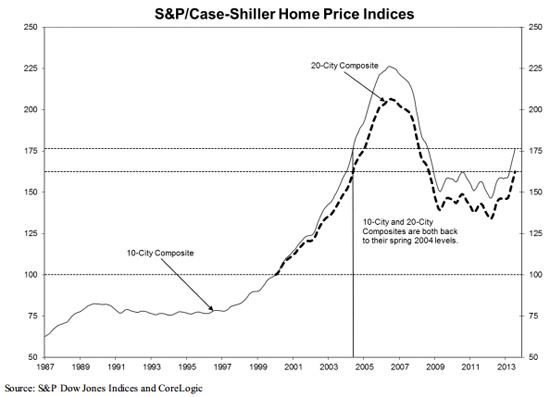
Prices nationally have returned to the levels last seen in the spring of 2004. Measured from the peak prices reached in the summer of 2006 the two composites are down approximately 21 to 22 percent and they have recovered from the troughs of March 2012 by 20.5 percent for the 10-City and 21.2 percent for the 20 City.
Chicago showed the greatest positive change from June to July at 3.2 percent, followed by Las Vegas at 2.8 percent. In both cases their increase was identical to the gain from May to June. Detroit had a monthly increase of 2.7 percent, slipping from the 3.1 percent improvement the previous month. Seattle, Tampa and Washington were the only three MSAs where returns increased from June to July. Cleveland showed the most weakness with a +0.5 percent return in July versus +2.0 percent in June.
Looking at the annual rates of change, thirteen cities showed acceleration with San Francisco posting its highest year-over-year return of 24.8 percent since March 2001. Atlanta, Boston, Charlotte, Detroit, Miami, Minneapolis and Phoenix were the seven MSAs with lower annual growth rates; the Twin Cities decreased the most with +9.5 percent in July compared to +11.5 percent in June. Although Detroit posted its 25th consecutive positive year-over-year return, it remains the only city below its January 2000 level.
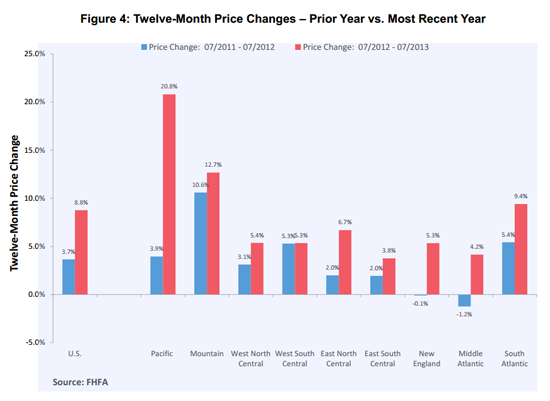
The FHFA index had an annual increase of 8.8 percent with all nine census divisions posting positive year over year numbers ranging from 20.8 percent in the Pacific region (Hawaii, Alaska, Washington, Oregon, California) to 3.8 percent in the East South Central (Kentucky, Tennessee, Mississippi, Alabama).
The monthly improvement in the national FHFA number was not reflected in all divisions. Price deprecation was reported in the East South Central division which was down 0.7 percent in July after increasing 1.3 percent from May to June. The West South Central Division (Oklahoma, Arkansas, Texas, Louisiana) also reversed directions, falling from a gain of 0.4 percent in June to an identical loss in July.
The S&P/Case-Shiller Home Price Indices combines matched price pairs for thousands of individual houses from the available universe of arms-length sales data and each index has a base value of 100 in January 2000; thus, for example, a current index value of 150 translates to a 50% appreciation rate since January 2000 for a typical home located within the subject market.
The FHFA HPI is based on home sales price information from repeat mortgages sold to or guaranteed by Freddie Mac or Fannie May.


