
Michael Fleming, Vice President, Research and Statistics Group of the Federal Reserve Bank of New York (FRBNY) recently provided a tutorial on the bank's blog, Liberty Street Economics on how to interpret and use new data on primary dealer activity. His article addresses the changes recently made to the way in which the data is collected, aggregated, and presented to the public.
By way of background, FRBNY has long collected market information from its primary dealer trading counterparts but until last April the data was only available for broad categories of securities rather than specific ones. Primary dealers are expected to provide data through a FR 2004 statistics reports which collect mostly weekly information on dealers' transactions, positions, financing, and settlement activities in U.S. securities, including agency debt, mortgage and asset-backed, corporate debt, and municipal securities. Most information is requested for broad categories of securities, although some is requested for specific Treasury security issues.
The data is collected on Wednesday, aggregated across dealers and released by the Fed a week later. The aggregated data have been analyzed in numerous studies and the transaction data in particular are widely cited as a gauge of market activity, and allow each reporting dealer to gain a sense of its market share in various products.
In April the Fed began releasing aggregated primary dealer data on specific Treasury issues. In particular, the data cover dealer activity in the most recently issued notes and bonds, including both nominal securities and Treasury inflation-protected securities; specific issue data are not collected for bills. This allows, Fleming says, for a more refined understanding of market conditions and dealer behavior.
Using charts for illustration, Fleming presented examples of the newly released data and how it can be useful. The chart below plots transaction data for the nominal notes and bonds. It shows that the nominal five- and ten-year notes are the single most active Treasury securities, with daily activity recently averaging about $100 billion each.
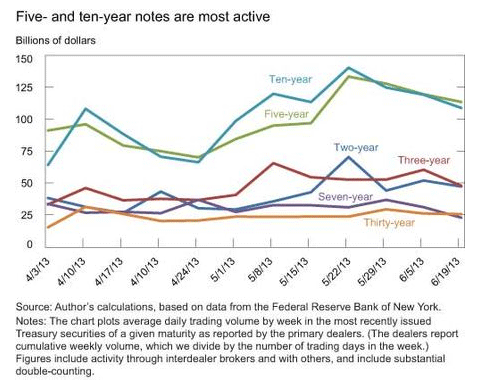
While these six issues represent a tiny fraction of some 300 nominal Treasury
securities outstanding, one can infer from the chart (and referring to
non-issue specific data) that they account for about 62 percent of all nominal
securities trading. Fleming said this illustrates
the widely known phenomenon of activity concentrating in the most recently sold
securities (on-the-run securities), dropping sharply in older securities when
new ones are auctioned. This high
concentration of trading in the on-the-run securities makes the issues
especially liquid, allowing market participants to transact in large size with
minimal price impact.
By looking at data for all (non-issue specific) trading through interdealer brokers one can see that the specific issues account for about 71 percent of all security trading through those dealers but only 55 percent of trading done through others. This is consistent with the idea that the dealers rely highly on the liquidity of the on-the-run securities to transfer interest rate risk among themselves.
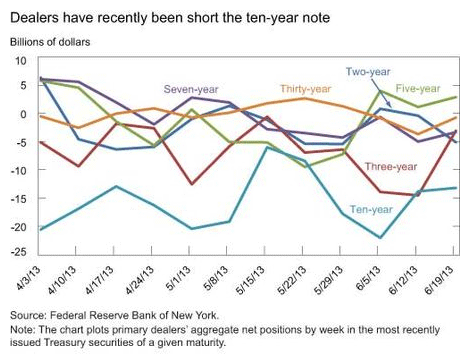
From the next chart one can see that dealers
have recently been long on Treasuries in general but short on these specific
issues, perhaps because of dealers' practice of hedging positions in other
instruments with on-the-run securities. This
past spring, the largest net short position of dealers was in the ten-year
note, with their aggregate net short position as large as $22 billion in
magnitude.
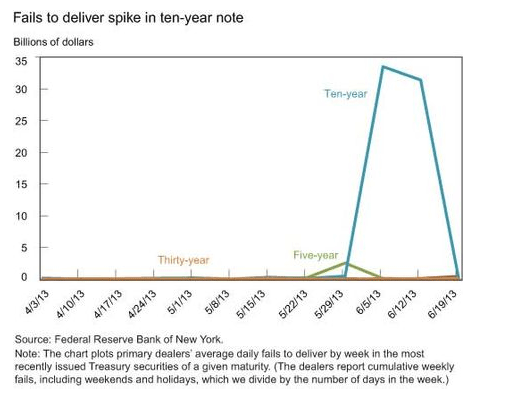
Fleming's final chart plots dealers' failures to deliver specific nominal
Treasury issues. Generally speaking,
fails tend to increase when issues get expensive to borrow and this happens
when there is either a high borrowing demand or low lendable supply. The chart shows a large spike in settlement
fails in the ten-year note, starting in the week ending June 5 and ending in
the week ending June 19, mirroring the maximum period of short positions in
those securities. While the dealer data
aren't comprehensive, they're suggestive of a large short base in the ten-year
note and of the resulting high borrowing demand leading to a high level of
fails.
The decline in fails in the week ending June 19, in contrast, is likely
attributable to supply considerations. Current Treasury policy is to issue a
new ten-year nominal note every three months, but to sell additional quantities
of the on-the-run note one and two months after its original issuance. The
Treasury thus issued $24 billion of a new ten-year note on May 15 and an
additional $21 billion of the note on June 17. The additional issuance
increased lendable supply, thereby easing the settlement disruptions in the
note.
Fleming says his review is merely intended to give a flavor of the new data and
how it can be used. Its benefits are
likely to grow over time as a history develops with which the data can be
analyzed more fully.


