
The Census Bureau and Department of Housing and Urban Development have released New Residential Sales data for June 2011.
New Residential Sales data provides statistics on the sales of new privately-owned single-family residential structures in the United States. Data included in the press release are (1) the number of new single-family houses sold; (2) the number of new single-family houses for sale; and (3) the median and average sales prices of new homes sold. New residential sales estimates only include new single-family residential structures. Sales of multi-family units are excluded from these statistics.
Here is a Quick Recap from Reuters...
RTRS - US JUNE SINGLE-FAMILY HOME SALES 312,000 UNIT ANN. RATE (CONS 320,000) VS MAY 315,000 (PREV 319,000)
RTRS - US JUNE SINGLE-FAMILY HOME SALES -1.0 PCT VS MAY -0.6 PCT (PREV -2.1 PCT)
RTRS - US JUNE HOME SALES NORTHEAST -15.8 PCT, MIDWEST +9.5 PCT, SOUTH +3.4 PCT, WEST -12.7 PCT
RTRS - US JUNE NEW HOME SUPPLY 6.3 MONTHS' WORTH AT CURRENT PACE, LOWEST SINCE APRIL 2010, VS MAY 6.4 MONTHS
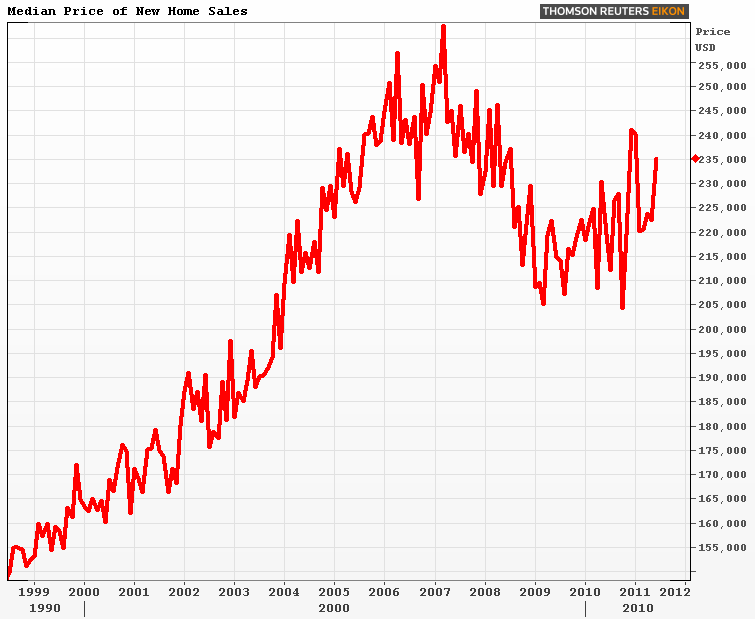
RTRS - US JUNE MEDIAN SALE PRICE $235,200, +7.2 PCT FROM JUNE 2010 ($219,500)
RTRS - US HOMES FOR SALE AT END OF JUNE RECORD LOW 164,000 UNITS VS MAY 167,000 UNITS

Excerpts from the Release...
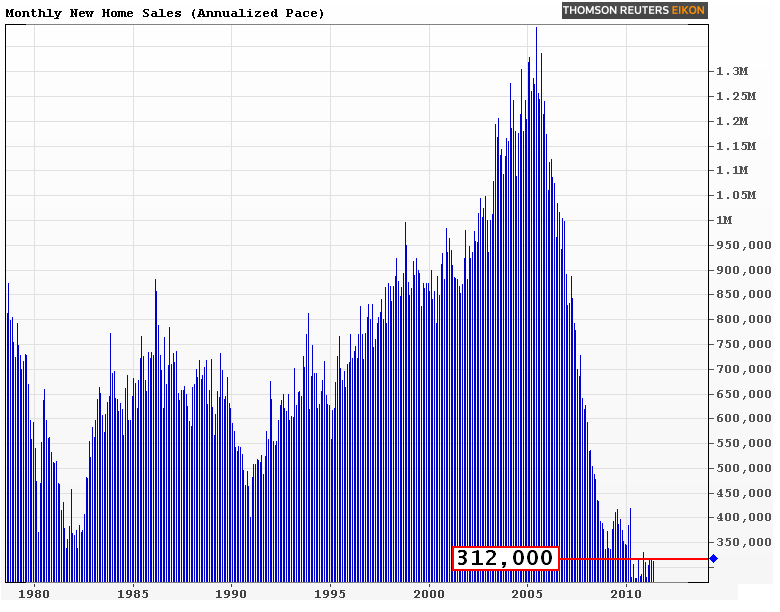
Sales of new single-family houses in June 2011 were at a seasonally adjusted annual rate of 312,000, according to estimates released jointly today by the U.S. Census Bureau and the Department of Housing and Urban Development. This is 1.0 percent (±12.5%)* below the revised May rate of 315,000, but is 1.6 percent (±14.1%)* above the June 2010 estimate of 307,000.
The seasonally adjusted estimate of new houses for sale at the end of June was 164,000. This represents a supply of 6.3 months at the current sales rate. The median sales price of new houses sold in June 2011 was $235,200; the average sales price was $269,000.
A few observations...
- The blue histogram chart above illustrates an estimation of New Home Sales that will have occurred by the end of 2011 if they continue at their current pace (annualized). One thing you might notice about that chart is its most recent additions look historically low. While the current pace of annualized sales is indeed above the record low of 278,000 seen in August 2010, at 312,000 we're not too far from the bottom! And we haven't been since April 2010 either, when the annualized pace was 420,000 New Home Sales. Same story different month....
- The "(±12.5%)" and "(±14.1%)" seen in this part of the report: "This is 1.0 percent (±12.5%)* below the revised May rate of 315,000, but is 1.6 percent (±14.1%)* above the June 2010 estimate of 307,000", represents the Standard Error of the survey results. When the Standard Error is bigger than the Commerce Department's estimation, which it was again, we would say the survey results are "Statistically Insignificant". Meaning we don't know if New Home Sales actually increased or decreased in May. The survey data is telling us NOTHING! A BETTER EXPLANATION
- Prices of new homes rose in June! We've actually seen a modest uptrend in new home prices since early 2009. This seems like a positive for the housing market right? Maybe. But is that a factor of fewer new homes being built? Probably. There were only 164,000 new homes available for sale at the end of June, that's the lowest number on record. Unfortunately the number of previously built homes on the market is what matters most. With the amount of EXISTING home inventory at 3.77 million units available for sale, we've got a long road to recovery ahead.
READ MORE: Lending Opportunity Seen in Home Rehab Biz


