
The Mortgage Bankers Association (MBA) today released its Weekly Mortgage Applications Survey for the week ending April 16, 2010.
The survey covers over 50 percent of all US residential mortgage loan applications taken by mortgage bankers, commercial banks, and thrifts. The data gives economists a look into consumer demand for mortgage loans. A rising trend of mortgage applications indicates an increase in home buying interest, a positive for the housing industry and economy as a whole.
Michael Fratantoni, MBA's Vice President of Research and Economics: "Treasury rates fell last week causing a decline in mortgage rates. As a result, refinance applications picked up over the week, as some borrowers took advantage of this recent rate volatility to lock in a low fixed-rate loan....Purchase applications continued to increase coming out of the Easter holiday, as we approach the end of the homebuyer tax credit, and are up modestly over last month."
From the release...
The Market Composite Index, a measure of mortgage loan application volume, increased 13.6 percent on a seasonally adjusted basis from one week earlier. On an unadjusted basis, the Index increased 13.9 percent compared with the previous week. The four week moving average for the seasonally adjusted Market Index is down 3.1 percent.
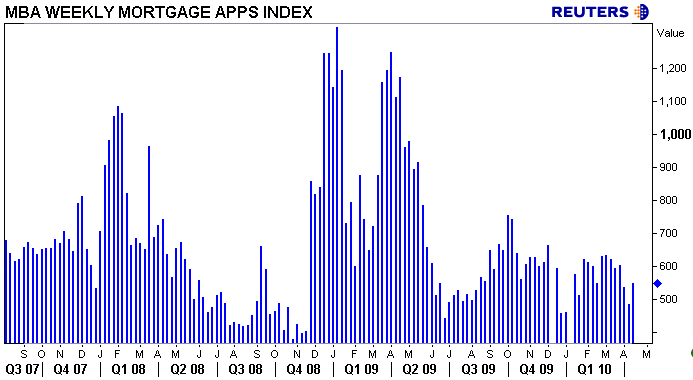
The Refinance Index increased 15.8 percent from the previous week. The four week moving average is down 5.9 percent for the Refinance Index. The refinance share of mortgage activity increased to 60.0 percent of total applications from 58.9 percent the previous week.

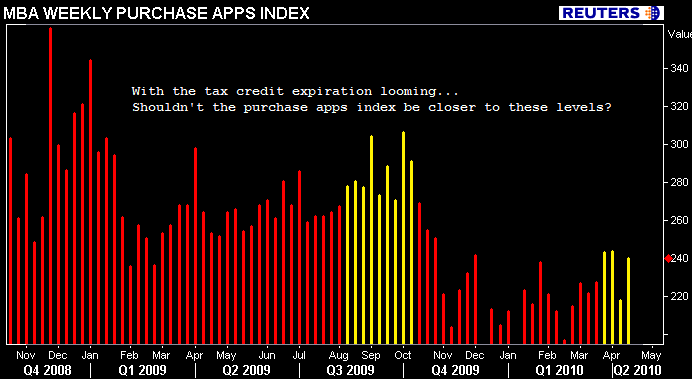
The seasonally adjusted Purchase Index increased 10.1 percent from one week earlier. The unadjusted Purchase Index increased 11.0 percent compared with the previous week and was 5.2 percent lower than the same week one year ago. The four week moving average is up 2.0 percent for the seasonally adjusted Purchase Index.
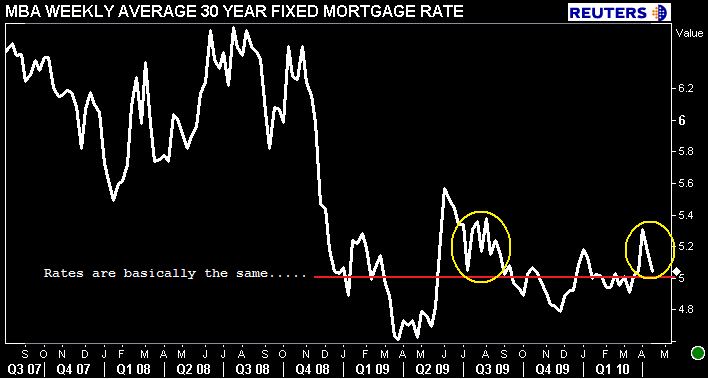
The average contract interest rate for 30-year fixed-rate mortgages decreased to 5.04 percent from 5.17 percent, with points increasing to 0.98 from 0.91 (including the origination fee) for 80 percent loan-to-value (LTV) ratio loans. The effective rate also decreased from last week.
The average contract interest rate for 15-year fixed-rate mortgages decreased to 4.34 percent from 4.45 percent, with points increasing to 0.98 from 0.80 (including the origination fee) for 80 percent LTV loans. The effective rate also decreased from last week.
The average contract interest rate for one-year ARMs decreased to 6.95 percent from 7.02 percent, with points increasing to 0.28 from 0.27 (including the origination fee) for 80 percent LTV loans. The adjustable-rate mortgage (ARM) share of activity decreased to
6.0 percent from 6.3 percent of total applications from the previous
week.
I was surprised to see purchase applications fall last week but fully expected them to rebound. This week all three mortgage loan demand indexes recovered from an Easter hangover and a modest rise in interest rates. Right back to where the indexes sat before the holiday distraction took effect..not much more positive progress beyond those levels.
In the charts above I pointed out, regardless of mortgage rates being almost the same, the purchase applications index is failing to match the levels seen during the Q3 2009 mini-housing boom (and is not even close to late 2008 levels). This is concerning but par for the course in my opinion. I think I have made it clear that I do not expect the extended version of the tax credit to provide much of a boost to home sales. Consumer perceptions of the housing market are poor as the labor market is just now starting to show signs of life. Meanwhile, banks are beginning to liquidate REO, adding to an already uncomfortably high amount of existing homes inventory.
Uncertainty in general has prohibted further positive progress in housing. I also feel that a big portion of the seasonal demand we should be feeling right now, was stolen by the rush to beat the expiration of the first time home tax credit in Q3 2009.
On the other hand, I've been hearing more and more stories of an increase in housing demand. Yesterday a Realtor called me and said he was having his best month in over two years and had just lost a purchase deal because another buyer bid more aggressively. Loan officers say they have great May and June pipelines but are battling rate shoppers in this uber-competitive mortgage rate environment. My own mother, a real estate appraisal (who refuses to work for an AMC) is busier than she's been since last spring.
Of course, these anecdotal accounts of building momentum come from specific regions. Mostly either where housing really got really whacked or where employment is stable and housing prices have clearly bottomed, like the DC metro area.
This makes me wonder though, how many (if any) "shadow buyers" is the MBA apps survey missing?
Besides the pool of potential homebuyers who might be waiting for the tax credit to expire (in hopes of home prices falling further as a portion of demand loses their incentive on April 30), what about the group of borrowers who are working with a correspondent lender or loan broker?
If these borrowers have yet to lock their loan, which is highly likely given the fall in mortgage rates and lack of new loan supply in the MBS market, perhaps the MBA's survey of retail commercial banks, thrifts, and mortgage banks is missing out on a portion of the overall "in process" pipeline?
Think about it. A third party originator takes a loan app, but the borrower wants to float down to a 30 day lock or maybe even a 15 day. So the loan officer never registers the loan with one of the pass-through lenders the MBA surveys. This implies the pass-through mortgage banker, retail bank, or thrift has yet to account for the mortgage application (or might never account for it if I am not correctly understanding the survey methodology).
There were some "issues" tied to following the MBA app survey when the likes of New Century were still in business...and writing the majority of loans. My question arises in the fact that the major "retail" lenders are the big banks, thrifts, and mortgage bankers who aggregate most of the loan production these days. I am not sure if the loan apps taken by a third party originators actually show up in the index when a TPO registers it or do loan brokers and correspondent lenders get treated the same way New Century did in the app survey?
I am not sure I am making the right underlying assumptions in this theory, but I emailed the Research Department at the MBA for more clarity.
Thoughts? Input appreciated...and please let us know what market you work in.
Hat tip to Matt Hodges for helping me better see the light on this group of potential "shadow buyers".


