
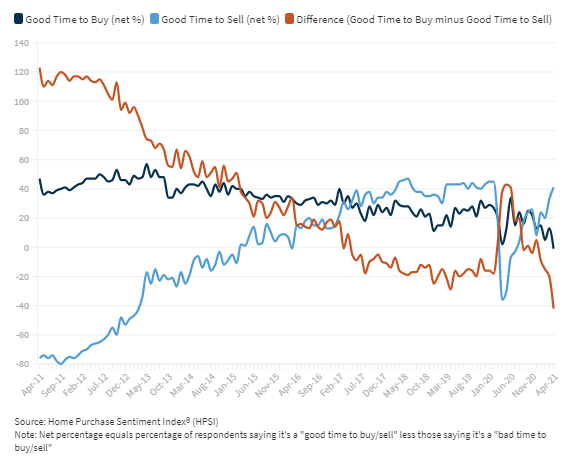
Fannie Mae has conducted the National Housing Survey every month since 2011. Among its most prominent questions are those relating to home buying and home selling: is it a good or a bad time to do either one? Last month the net positive responses for the good time to buy category fell into negative territory for the first time.
The good time to sell question had plunged into seriously negative territory (-36 percent) in the spring of last year as the pandemic hit, but this time it remained well above water. Sixty-seven percent of respondents viewed this as a good time to sell versus 26 percent who did not, a net positive of 41 percent, an 8 point gain from March and up 77 points from the disastrous results during the lockdown.
However, only 47 percent of respondents thought it was a good time to buy a home while 48 percent differed. This dropped the net 14 points to a negative 1 percent, three points below the level in April 2020.
The two good time/bad time questions are among the six which Fannie Mae uses to construct its Home Purchase Sentiment Index (HPSI). That measure fell by 2.7 points in April to 79.0. Three of the other four components were also declined during the month, but, given the conditions a year earlier, the HPSI was still up 16 points year-over-year.
"April's HPSI reading appears to have been acutely impacted by the ongoing lack of housing supply despite improving economic conditions," said Doug Duncan, Senior Vice President and Chief Economist. "Consumer sentiment toward buying homes reached the lowest level in our survey's ten-year history; unsurprisingly, respondents overwhelmingly cited the lack of supply and high home prices as primary reasons for their pessimism. The decrease in homebuying sentiment likely indicates that some consumers, potentially flush with savings - perhaps boosted in part by stimulus payments - may be attempting, but failing, to buy a home due to heightened competition for relatively few listed homes. Notably, consumers in the household income range of $50,000 to $100,000, a range inclusive of the Census Bureau's reported median household income level, showed a particularly large decrease in overall housing sentiment, and we know that the housing market serving the affordable segment has been particularly competitive."
Duncan continued, "Conversely, consumer positivity regarding home-selling conditions nearly matched its all-time high, demonstrating a large divergence in perceived conditions between sellers and buyers, as measured by the gap between the two components. As has become standard discourse in the housing industry recently, increasing the supply of homes for sale would certainly help bring balance to this strong seller's market, but unfortunately the most recent data doesn't suggest that inventory is likely to improve in the near future."
The only increase other than the good time to sell component was those expecting mortgage rates to decline. That net is nearly always a negative number and in April it was -47 percent, a 1 point gain from the prior month.
The remaining components that declined month-over-month were those reflecting the percentage of survey respondents who say they are not concerned about losing their jobs, those who reported an increase in household income, and respondents who expect home prices will continue to rise.
The percentage of those not concerned about losing their jobs over the next 12 months remained high, at 80 percent, down from 82 percent while those who expressed concern dipped 1 point to 16 percent, knocking the net of those who were not concerned down 1 point to 64 percent.
Twenty-one percent reported significantly higher household income than a year later while 17 percent says income had fallen (the remainder reported no change.) this left a net of 4 percent with higher income, down 4 percent from the March survey.
The National Housing Survey from which the HPSI is constructed, is conducted monthly by telephone among 1,000 consumers, both homeowners and renters. In addition to the six questions that are the framework of the index, respondents are asked questions about the economy, personal finances, attitudes about getting a mortgage, and questions to track attitudinal shifts.


