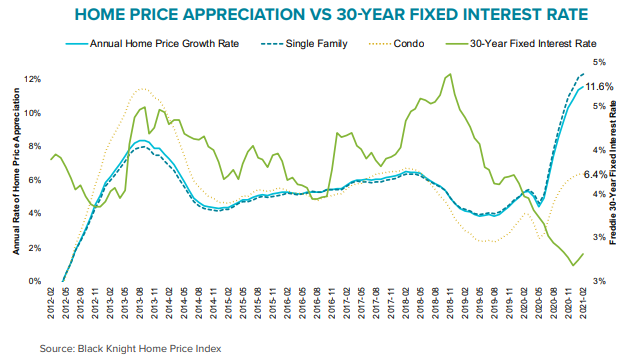
Stories of rising home prices are no longer breaking news, but still, they are pretty remarkable. Black Knight, in its latest Mortgage Monitor, says the 12.3 percent growth in the selling price of single family homes in February was the highest such annual home price growth of any month on their records dating back to 1992. The overall price growth during the month was 11.6 percent, dragged lower by a 6.4 percent growth rate in condo prices.
The company says this discrepancy bears watching. Condos typically appreciate more quickly when the housing market heats up, as it certainly has over the last year, and decelerate more quickly when markets cool. This reversal of historical patterns may suggest underlying weakness in the condo market. Perhaps this is driven by the pandemic and fears of living in close quarters.
Black Knight's Collateral Analytics team puts the years price appreciation even higher, at nearly 15 percent. The team runs market condition ratings for every CBSA and ZIP code in the U.S., using the most recent sales and active listing data, and rates them on an array of market indicators. These include trends in sold/active prices, inventory levels, sold/active market times, and sold-to-list price ratios. Each ZIP code is then given a qualitative rating, ranging from hot to distressed. Historically, about two-thirds to four-fifths of all markets fall in the middle three categories ("good," "normal" or "soft"), while less than 10 percent are considered in either the "hot" or "distressed" categories at the top or bottom of normal cycles.
As of February 2021, about 75 percent of ZIPs are currently either "strong" (47 percent) or "hot" (28 percent) markets, the highest share on record for either category and more than twice the previous record set back in late 2017. At the same time, those categories considered "soft," "weak" or "distressed" have nearly disappeared from the charts. Just 36 of the more than 14,600 ZIPs analyzed fell into these categories and only 7 percent of ZIP codes are categorized as "normal," down from 43 to 44 percent in both February 2020 and 2019.

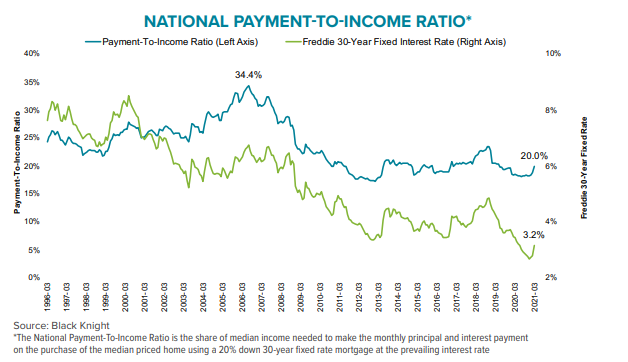
Black Knight Data & Analytics President Ben Graboske says incredibly low levels of for-sale inventory, coupled with still historically low interest rates, continue to put upward pressure on home prices and tighten affordability. "Of course, upward pressure on home prices has also served to tighten affordability, and with rates on the rise, affordability concerns are coming into sharper relief. It now takes 20 percent of the median income to make the monthly payment on the purchase of an average-priced home, back up to the five-year average after several years of low interest rates mitigating the impact of rising prices. on affordability. Housing is now the least affordable it's been - factoring in interest rates, home prices and income - since mid-2019."
The monthly principal and interest payment required to purchase the average priced home with 20 percent down has increased by $108 per month to $1203 since the beginning of the year. This is the highest the payment has been since late 2018 when the average home price was 16 percent lower, but the average 30-year rate was 17 points higher at 4.87 percent. The 20 percent of income required to make that payment is back to the 5-year average but still remains lower than the 20-year average of 23.4 percent. Over recent years the point between an acceleration and a deceleration in the housing market has been around 20.5 percent. At current price levels it would only take 30-year rates rising to 3.4 percent to push the payment-to-income ratio to that point.
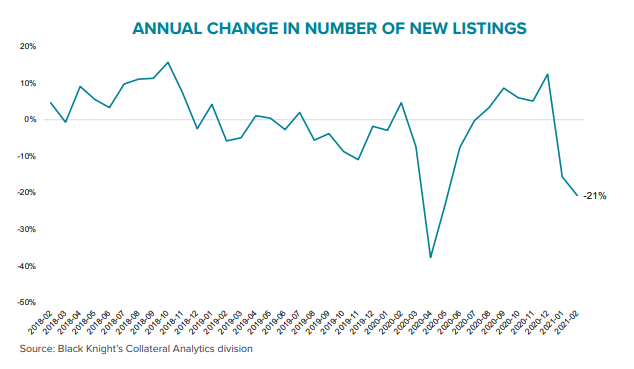
Graboske, says Any hopes of 2021 bringing an influx of homes to the market and lessening pressure on prices appear to be dashed for now, as new for-sale listings were down 16 percent and 21 percent year-over-year in January and February, respectively. "Rather than an influx of homes on the market, we're now 125,000 fewer new listings in the hole compared to the first two months of 2020 and trending in the wrong direction. With higher interest rates and a continuing shortage of inventory, it will be important to keep a careful eye on both home prices and affordability metrics in the coming months."
Those 125,000 fewer available homes represent a 40 percent year-over-year decline, and the supply of single-family homes is 46 percent lower. Condo inventory has held up better, it is down only 15 percent. New listings typically reach a peak in May so that volume as well as the direction of interest rates will largely dictate the trajectory of the 2021 housing market.
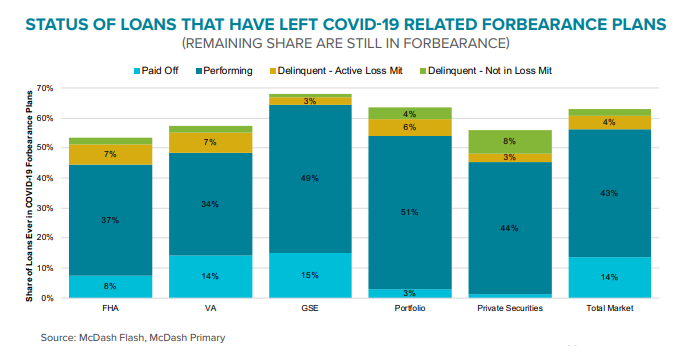
The Monitor also updated the current disposition of loans that are in or have exited forbearance. As of March 23, there have been seven million homes in forbearance programs since about the same time last year when the pandemic struck. About 43 percent of those loans have exited the program and are now performing. Another 167,000 have exited (2 percent) and are delinquent and not in loss mitigation, but 107,000 of those were non-current heading into the pandemic. Former participants who are in loss mitigation total 306,000 or 4.0 percent. Fourteen percent of forborne loans have been paid off, and 5 percent are new entries, in their first three month forbearance term. Graboske, his leaves 2.198 loans still in the program, about 32 percent.
Black Knight says performance results continue to vary by investor class. Sixty-eight percent of GSE borrowers have exited and two-thirds are performing or have paid off their loans. Borrowers serviced for bank portfolios or private label securities have the largest shore of borrowers remaining delinquent post-forbearance, but most were not performing prior to the program. FHA loans have seen the lowest share of borrowers leaving the plans.