
Even as the COVID-19 pandemic began to hobble home sales in many locations, home prices continued to increase. the Federal Housing Finance Agency's (FHFA's) House Price Index (HPI) held to its 5.7 percent gains the prior month while the S&P CoreLogic Case-Shiller U.S. Home Price Indices posted larger annual increases in March than in February.
The S&P CoreLogic Case-Shiller U.S. National Home Price NSA Index, covering all nine U.S. census divisions, reported a 4.4 percent annual gain in March, up from 4.2 percent the previous month. The 10-City Composite's annual increase came in at 3.4 percent, up from 3.0 percent and the 20-City Composite rose from a 3.5 percent growth in February to 3.9 percent.
The National Index posted a 0.8 percent month-over-month increase, while the 10-City and 20-City
Composites were up 1.0 percent and 1.1 percent respectively before seasonal adjustment. After seasonal adjustment, both the National Index and the 20-City Composite rose 0.5 percent and the 10-City Composite was up 0.4 percent.
Because of office closings in due to the pandemic in Michigan, sales transaction data in Wayne County, the most populous county in the Detroit metro area, has not been accounted for and Case-Shiller says it is not able to generate a valid March 2020 update for the area. Excluding Detroit, however, the remaining 19 cities reported price increases for March both before and after seasonal adjustment.
Phoenix, Seattle, and Charlotte had the highest year-over-year gains among the 19 cities. Phoenix led the way with an 8.2 percent followed by Seattle with a 6.9 percent increase and Charlotte, up 5.8 percent. Growth was larger in 17 of the 19 cities for the year ending March 2020 versus the year ending February 2020.
"March's data witnessed the first impact of the COVID-19 pandemic on the S&P CoreLogic Case-Shiller Indices," says Craig J. Lazzara, Managing Director and Global Head of Index Investment Strategy at S&P Dow Jones Indices. "We have data from only 19 cities this month, since transactions records for Wayne County, Michigan were unavailable.
"That said, housing prices continue to be remarkably stable. The National Composite Index rose by 4.4 percent in March 2020, with comparable growth in the 10- and 20-City Composites (up 3.4 percent and 3.9 percent, respectively). In all three cases, March's year-over-year gains were ahead of February's, continuing a trend of gently accelerating home prices that began last autumn. March results were broad-based. Prices rose in each of the 19 cities for which we have reported data, and price increases accelerated in 17 cities.
"At a regional level, Phoenix retains the top spot for the tenth consecutive month, with a gain of 8.2 percent for March. Home prices in Seattle rose by 6.9 percent, followed by increases in Charlotte (5.8 percent) and Tampa (5.7 percent). Prices were particularly strong in the West and Southeast, and comparatively weak in the Midwest and Northeast.
"Importantly, today's report covers real estate transactions closed during the month of March. Housing prices have not yet registered any adverse effects from the governmental suppression of economic activity in response to the COVID-19 pandemic. As much of the U.S. economy remained shuttered in
April, next month's data may show a more noticeable impact."
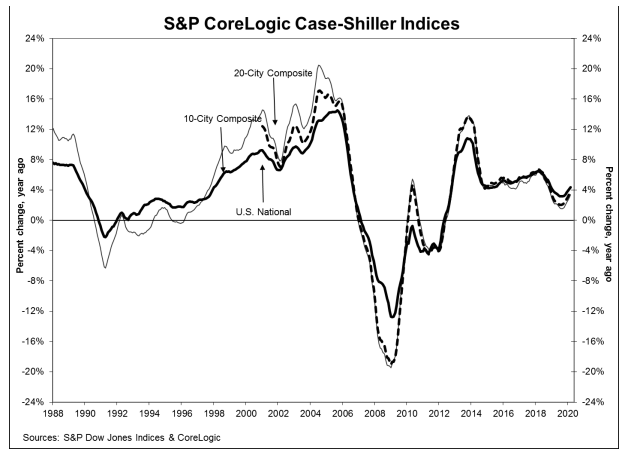
Home prices on the National Index are now 16.4 percent higher than at the previous peak in July 2006. The 10-City Composite has exceeded its previous high by 3.8 percent and the 20-City is 7.6 percent higher.
The S&P CoreLogic Case-Shiller Home Price Indices are constructed to accurately track the price path of typical single-family home pairs for thousands of individual houses from the available universe of arms-length sales data. The National U.S. Home Price Index tracks the value of single-family housing within the United States. The indices have a base value of 100 in January 2000; thus, for example, a current index value of 150 translates to a 50 percent appreciation rate since January 2000 for a typical home located within the subject market.
As of January 2020, the National Index was at 214.96 compared to 213.16 in February. The 10- and 20-City Composites had readings of 234.83 and 222.21 respectively, compared to 233.32 and 219.75 the prior month. Los Angeles has the highest index reading at 293.957 and Cleveland (absent data on Detroit) the lowest at 128.43.
The FHFA HPI report for March is also a quarterly summary and the index for that period was up 1.7 percent in the second quarter of 2020 compared to the first quarter. For the month of March, prices were 0.1 percent higher than in February.
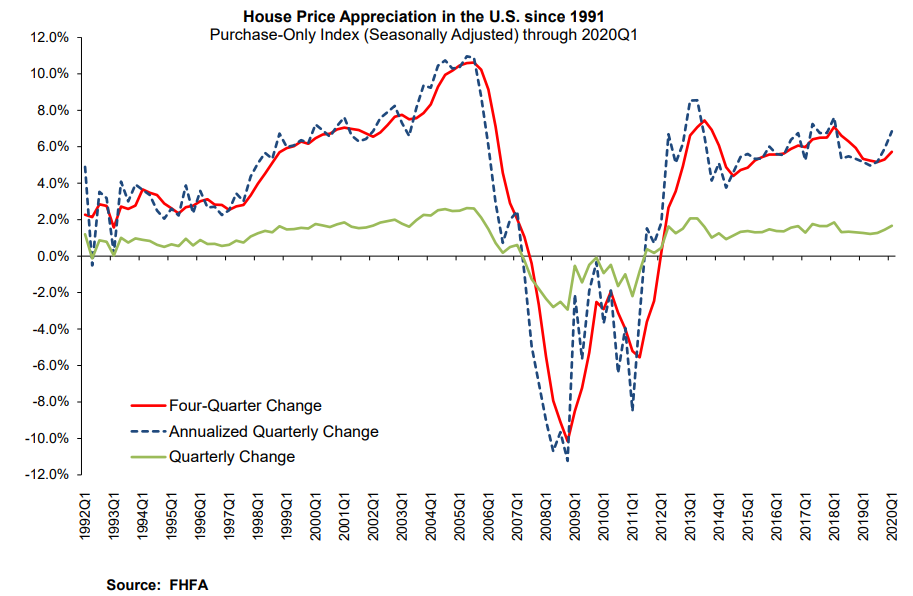
FHFA, however, appended a big caveat to their March numbers. They cautioned that the data is unlikely to reflect the economic impact of the crisis as price movements are estimated from closings through March 31st, but, because of the time delay between when a contract is signed and a loan closes, purchase data from March largely reflect prices that were set in late-January and throughout February and reflect prices agreed upon before broad stay-at-home orders were issued.
"Home price growth in the first quarter outpaced annual growth from the same period a year ago as falling interest rates and shrinking inventories for sale led prices higher just prior to the crisis. Prices in the Mountain Division, encompassing the top four states by growth, grew by 8 percent on a year over year basis," said Dr. Lynn Fisher, Deputy Director of the Division of Research and Statistics at FHFA. "Because of the lag between contract signing and sale closing when our data are recorded, we judge the first quarter's housing statistics were relatively unaffected by the COVID-19 outbreak. However, we are unable to account for any modifications or cancellations of sales later in March."
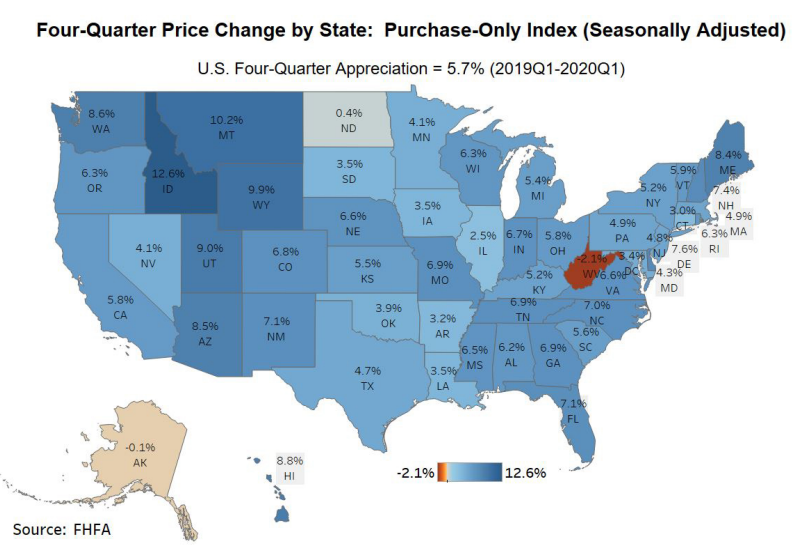
The top five states for annual appreciation were: 1) Idaho 12.6 percent; 2) Montana 10.2 percent; 3) Wyoming 9.9 percent; 4) Utah 9.0 percent; and 5) Hawaii 8.8 percent. Prices were up in all of the top 100 metro areas but were the greatest in Boise City at 13.1 percent. While the West was the strongest region, the West South Central Division was the weakest with a 4.3 percent annual increase. House prices have risen for 35 consecutive quarters, or since September 2011.
FHFA's House Price Index is based on the sales prices of homes purchased with Fannie Mae or Freddie Mac financing. The index was benchmarked at 100 in January 1991. The current reading is 287.9.


