
Rapid price gains, long dominated by cities in the West, appear to be shifting to the Southeast, at least those reflected in the S&P CoreLogic Case-Shiller indices. The report for August notes that Las Vegas is no longer among the top three metro areas for annual price gains. After occupying the top spot for several years, it recently slipped down to second and has now fallen to number eight. Three of the top four cities are now in the Southeast.
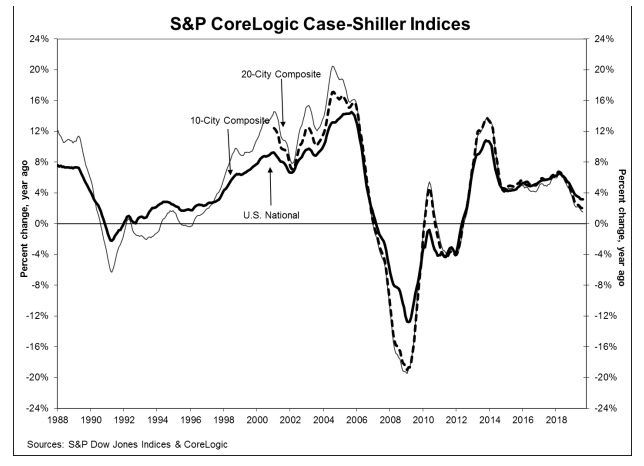
The Case-Shiller non-seasonally adjusted (NSA) National Home Price) Index, which covers all nine U.S. census divisions, reported a 3.2 percent annual gain in August, up from 3.1 percent the previous month. Before seasonal adjustment, the National Index posted a month-over-month increase of 0.2 percent and was 0.3 percent higher after seasonal adjustment.
The 10-City Composite rose 1.5 percent on an annual basis compared to 1.6 percent the prior month and the 20-City Composite rose 2.0 percent, the same annual increase as in July. Neither of the composites posted gains for the month before seasonal adjustment and both were lower than in July on an adjusted basis. The 10-City dipped by 0.1 percent and the 20-Ciity fell 0.2 percent.
Phoenix, Charlotte, and Tampa reported the highest year-over-year gains among the 20 cities. Phoenix remained in the top spot, up 6.3 percent, followed by Charlotte with a 4.5 percent increase and Tampa up 4.3 percent. Seven of the 20 cities reported greater price increases in the year ending August 2019 versus the year ending July 2019.
"The U.S. National Home Price NSA Index trend remained intact with a year-over-year price change of 3.2 percent," according to Philip Murphy, Managing Director and Global Head of Index Governance at S&P Dow Jones Indices. "However, a shift in regional leadership may be underway beneath the headline national index.
"Phoenix saw an increase in its YOY price change to 6.3 percent and retained its leading position. However, Las Vegas dropped from number two to number eight among the cities of the 20-City Composite, falling from a 4.7 percent YOY change in July to only 3.3 percent in August. Meanwhile, the Southeast region included three of the top four cities. Charlotte, Tampa, and Atlanta all recorded solid YOY performance with price changes of 4.5 percent, 4.3 percent, and 4.0 percent, respectively. In the Northwest, Seattle's YOY change turned positive (0.7 percent) after three consecutive months of negative YOY price changes. The 10-City Composite YOY price change declined slightly from July to 1.5 percent, while the 20-City Composite YOY price change remained steady at 2.0 percent. San Francisco was the only city to record a negative YOY price change, -0.1 percent."
All three of the indices are higher than their 2006 peaks. The National Index is up 14.9 percent, the 20-City has bypassed its earlier peak by 5.6 percent and the 10-City by 2.0 percent.
The S&P CoreLogic Case-Shiller Home Price Indices are constructed to accurately track the price path of typical single-family home pairs for thousands of individual houses from the available universe of arms-length sales data. The National U.S. Home Price Index tracks the value of single-family housing within the United States. The indices have a base value of 100 in January 2000; thus, for example, a current index value of 150 translates to a 50 percent appreciation rate since January 2000 for a typical home located within the subject market.
As of August 2019, the National Index was at 212.06 up from 211.72 in July. The 10- and 20-City Composites had readings of 230.83 and 218.14 respectively, compared to 230.74 and 218.00 the prior month. Los Angeles has the highest index at 286.04 and Cleveland the lowest at 127.75.


