
The annual State of the Nation's Housing report from the Joint Center for Housing Studies (JCHS) at Harvard University is the latest vehicle for sounding the alarm about the country's diminishing housing stock and the resulting decline in affordability. Although the economy has recovered from the Great Recession and household growth has returned, housing production has not. The report says, "the shortfall in new homes is keeping the pressure on house prices and rents, eroding affordability-particularly for modest-income households in high-cost markets."
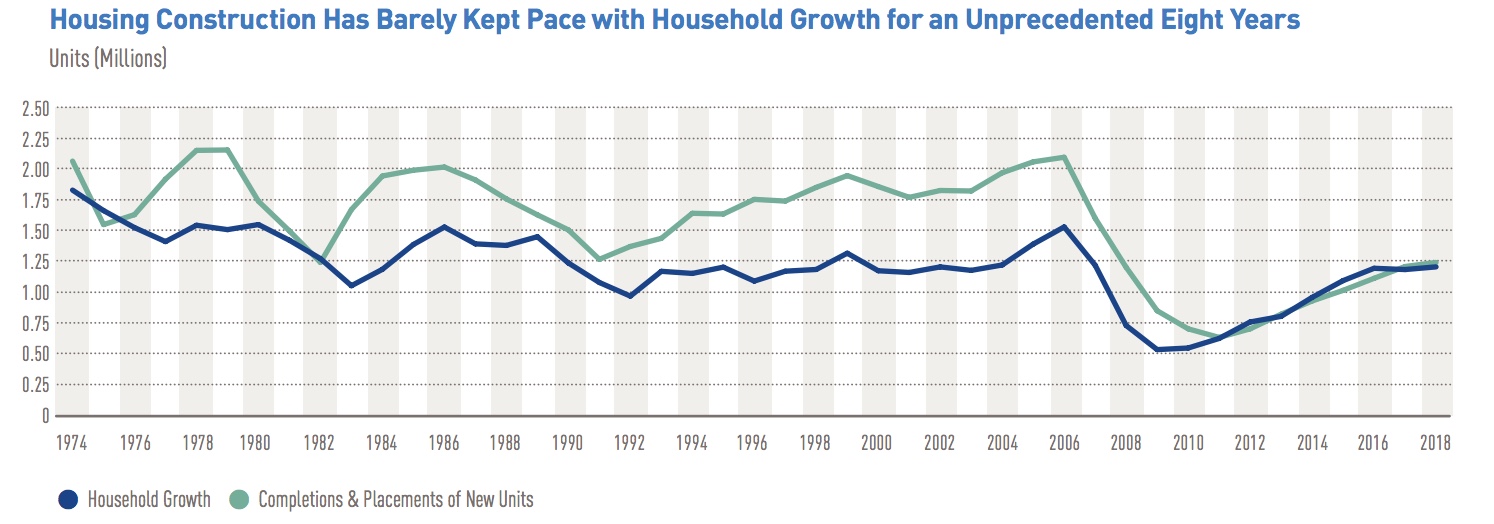
Since reaching bottom in 2011 at 633,000, additions to the housing stock have grown at an average annual rate of 10 percent, but in seven years reached only 1.2 million units. When the last ten years are excluded, 2018 was the lowest annual production since 1982. Some of this lack of production is the lingering effect of the weak growth in households during and after the recession. Now that growth has picked up, new construction remains depressed; additions to supply are just staying even with the addition of new households. As a result, the national vacancy rate for both owner-occupied and rental units reached 4.4 percent last year, its lowest point since 1994.
The report notes that historically there have been brief periods of constrained residential construction, but the duration of the current run is unprecedented. Since 1974 annual additions to the supply typically exceeded household growth by 30 percent, enough to allow replacement of older housing, demand for second homes, population shifts across markets, and slack for normal vacancies. The JCHS estimates that pace would put annual construction at 1.5 million units, 260,000 more than were built last year.
The report identifies several reasons for the slow recovery in residential construction. An excess supply of houses built up near the end of the boom, creating a peak vacancy rate of 6.2 percent by 2009. It took years to absorb the surplus, making builders and lenders wary of too rapidly expanding the supply. Many skilled workers left construction during the recession, taking jobs in other fields and worsening existing labor problems. Meanwhile, the housing that is being built tends toward the high end. The report says land, labor, and material costs may make it unprofitable to build for the middle market.
Homeownership fell for 12 consecutive years, starting slightly before the recession. It finally started to edge higher in 2017, reaching 64.4 percent in 2018. The number of households grew by 2.8 million between 2016 and 2018 with the largest increase, 2.0 percent or 1.1 million households in the key age group of 25-39-year-olds. The homeownership rebound was in the face of worsening affordability. After the housing crash, we experienced the most affordable conditions in decades with an inflation-adjusted monthly payment of a median-priced home in 2012 at $1,176, down 45 percent from the 2006 peak and 36 percent compared to 1990.
While interest rates have remained low, home prices have climbed steadily and the monthly payment at the end of last year was $1,775, only 3 percent lower than in 1990 within 17 percent of the 2006 peak. This was mitigated a bit by strong income gains among younger households.
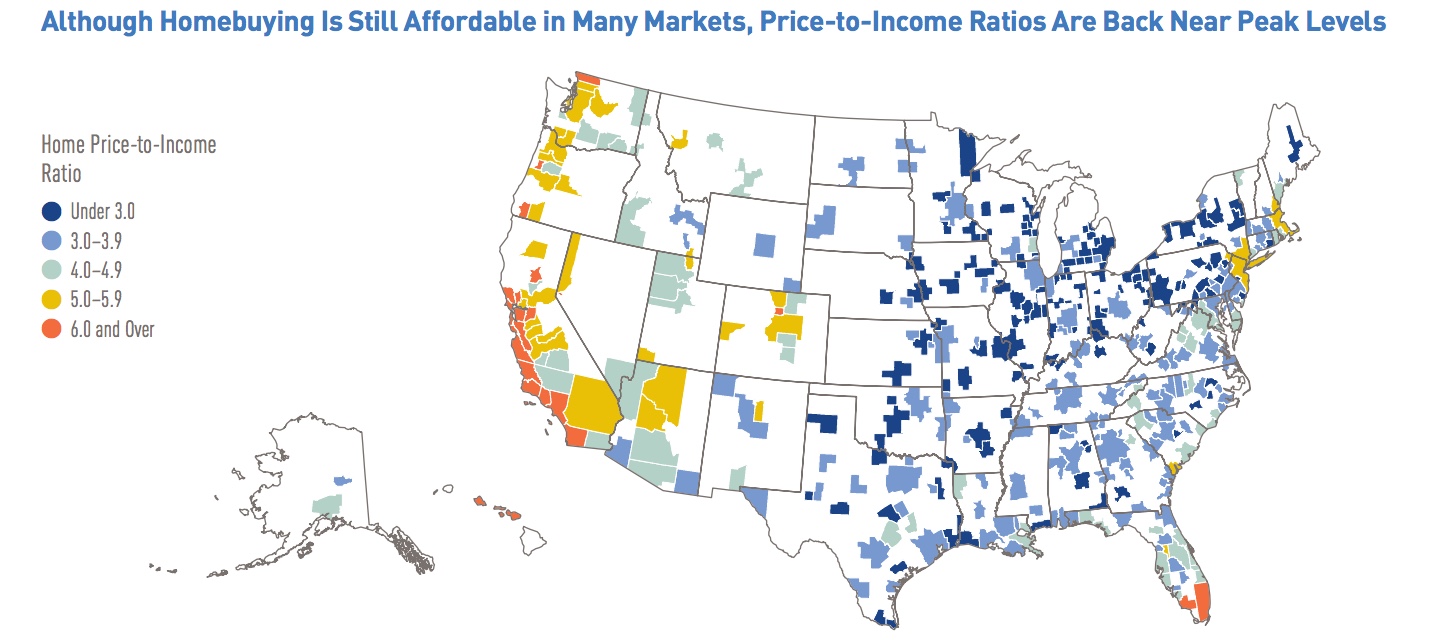
A common yardstick of affordability, the ratio of median home price to median income indicates that the income gains are not enough. The national ratio rose sharply from 3.3 in 2011 to 4.1 in 2018, just under the 4.7 peak in 2005. But there are large geographic differences. In one in seven metro areas, primarily those on the West Coast, the ratio exceeds 5.1 while it is less than 3.1 in about one in three metros, primarily in the Midwest and South. Where the ratio is above 5.1 a median income household could afford just 36 percent of recently sold homes in 2017 while with a ratio under 3.0, they could afford 84 percent.
Most buyers require a mortgage and access to financing tightened significantly after the crash and remained tight, especially for less creditworthy borrowers. Recently the percentage of loans with debt-to-income (DTI) ratios above 43 percent have increased, doubling for Fannie Mae from 13 to 29 percent and increasing from 14 percent to 25 percent for FHA. The 43 percent DTI is a standard set by the Consumer Financial Protection Bureau (CFPB) for qualified mortgages but does not apply to FHA or, under a temporary exception which expires in 2021, to GSE (Fannie Mae and Freddie Mac) loans. The expiration could result in a substantial shift in GSE lending volumes to FHA at a higher cost for borrowers or a sharp reduction in credit access for those with these high DTI ratios.
According to the latest JCHS projections, if age-specific homeownership rates remained at the same level as in 2018, household growth alone would add roughly 8.0 million homeowners between 2018 and 2028. If they continue the current trend, overall homeownership will increase by 1.6 percentage points and the number of homeowners could reach 10.1 million for the decade. If interest rates and home prices rise and credit tightens and with the limited supply of entry-level housing, homeownership could move out of the reach of many more households.
There are looming problems for renter households as well. The Census Bureau says their total number fell in 2017-2018 by 239,000 households, a contrast to annual increases of 850,000 renter households on average for each of the previous 12 years. Thirty-one states lost renters from 2015 to 2017. The trend, however, appears to be reversing with an uptick early this year. JCHS projects there will be a net of 400,000 new renter households annually over the next decade.
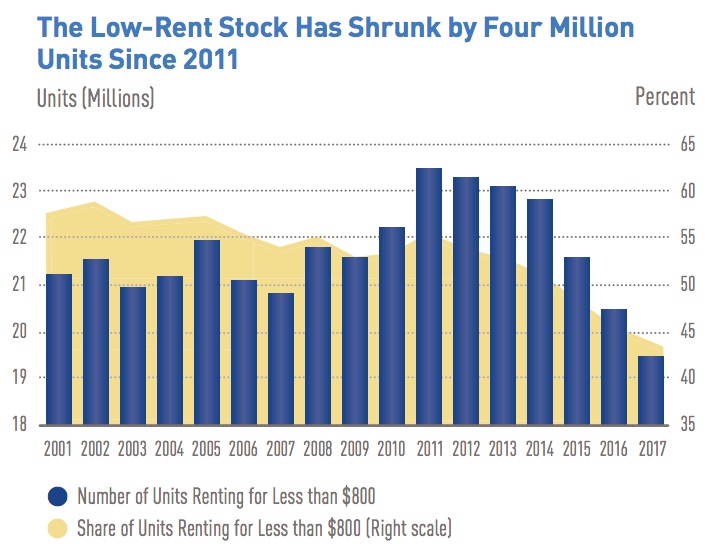
The Consumer Price Index indicates that overall rents rose at a 3.6 percent annual rate in early 2019, or twice the pace of overall inflation. Low and falling vacancy rates are keeping the pressure on rents, with the national vacancy rate sliding from 7.2 percent in 2017 to 7.0 percent in the first quarter of 2019. These conditions seem somewhat at odds with the falloff in demand and the continued strength of rental construction, but the demand was coming from higher-income households. High-end rentals are also the sector where much of the multifamily construction has been taking place. There was also a 338,000-unit decline in rental housing in 2017, most were single-family homes and units in two-to-four-unit buildings likely converted to owner occupancy. Even if homeownership rates continue to increase, low vacancy rates and shifts in the existing stock are likely to prevent a significant softening of rental markets, especially at the lower end. The number of units renting for under $800 fell by 1.0 million in 2017 alone.
A household is considered cost-burdened if they pay more than 30 percent of their incomes for housing and those households declined for the seventh straight year in 2017, to 47.4 percent, 5.7 percent below the 2010 peak. The total number of cost-burdened households in the US also fell by 4.9 million in 2010-2017, to 37.8 million, but most of the improvement went to homeowners. Cost-burdened renters now outnumber cost-burdened homeowners by more than 3.0 million and represent 10.8 million of the 18.2 million of severely burdened households, where housing consumes more than half of incomes. In addition, the threshold income of cost-burdened households has steadily increased. Where households are cost-burdened they have less residual income to pay for other necessities such as healthcare, transportation, even food.
There have been notable reductions in homelessness over the past decade. According to HUD's annual point-in-time counts, the number of people experiencing homelessness fell by 87,000 from 2008 to 2018 and by some 38,000 in the last five of those years. This progress reflects an expansion of permanent supportive housing and the widespread adoption of the "housing first" model that provides housing without preconditions and before addressing other problems such as addition, healthcare, or job training. The improvements have been most evident among populations that have received targeted efforts and resources-veterans, families, and the chronically homeless.
Despite this progress, however, the unsheltered population is on the increase-particularly in certain high-cost Western states. The problem is most acute in California, where the number of unsheltered homeless grew by 25 percent in 2014-2018, to 89,500. Unsheltered homelessness has all increased significantly in Washington, Colorado, and Oregon.
That homelessness is visible has prompted some commitments from state and local governments for housing options. Again, California and some of its major cities have taken the lead.
Although these measures provide much-needed funds to get people off the streets and into stable housing, a near-record number of renters in these high-cost areas still face significant housing challenges. Meeting the need for decent, affordable housing in these markets will require a targeted and sustained strategy supported by both the public and private sectors.
The outlook for housing over the next decade will be shaped by two groups, Millennials and Baby Boomers. JCHS projects that households headed by those in their mid-30s to mid-40s will grow by 2.9 million over the decade while those headed 65-year-olds or older will rise by 11.1 million. The age group in-between these two will decline by 1.9 million as the older of the smaller gen-Xers replace the younger boomers in the next higher group. The oldest age group will include an additional 8.4 million households without children at home. This should mean a demand for smaller houses, but most older adults plan to remain in their current homes, fueling a demand for remodeling. Even if a minority of this large age group opts to relocate, it should stoke demand for smaller, more accessible homes.
Within the youngest age group, two-thirds of household growth will be families with children and demand for owner-occupied housing is projected to grow substantially over the decade, especially for entry-level homes. However, today's relatively low homeownership rates for this age group will also drive the 400,000-yearly growth in renters mentioned above.
Whether these projections are realized will depend on a number of factors. One is economic as the ability to form a household depends on income. Foreign immigration is another as the net growth in the native-born population continues to decline. If efforts to curtail immigration prevail, future housing demand will be much lower than projected. Another factor is housing costs. If they continue to rise faster than incomes, household growth and housing demand are likely to slow.
If current housing supply trends persist, house prices and rents will continue to rise, further limiting housing options for many. The public, private, and nonprofit sectors must address constraints on the development process and greater public efforts will be required to close the gap between what families can afford and the cost of producing decent housing.


