
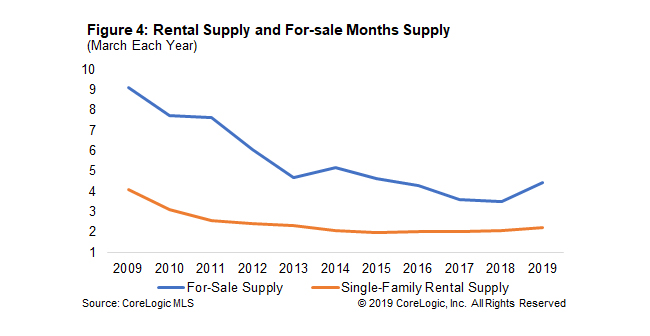
There probably hasn't been a report on home sales or prices in the last four years that hasn't referred to the role of housing inventory in the depressed level of the former or the rapid acceleration of the latter. According to data from CoreLogic, there was a 4.5-month supply of homes available at the current rate of sales in March. (We assume that number includes both new and pre-owned homes.) This is less than half the supply, 9.1 months, available in March 2009.
Shu Chen writes in CoreLogic's Insights blog that that both new construction and the mobility of homeowners have traditionally driven inventories and those are at low levels, but the shifting of homes to the rental market has also played a large role. This shift, of course, started with the housing crisis as millions of owner-occupied homes were foreclosed and thousands sold to investors. They also purchased many of the homes transferred through short sales.
Using Multiple Listing Service data for 48 metro areas, CoreLogic found that the share of homes listed as rentals constituted 8.7 percent of all available homes in March 2011 and for 14.2 percent in March 2018.
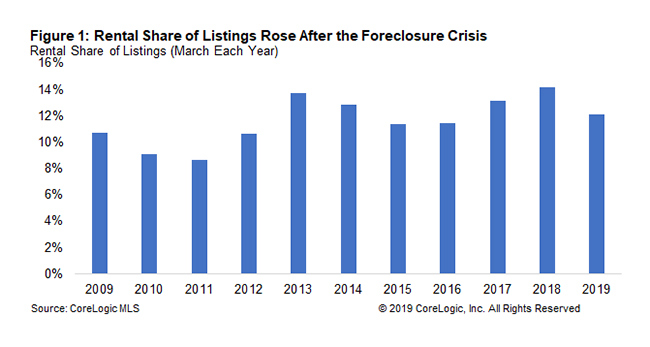
While the average rental share had eased back to 12.1 percent by this March, the share is much higher in some of metro areas. Boston tops the list at a near 25 percent share and Miami, Austin, Philadelphia, and Honolulu were all above a 20 percent rental share. Chen said the list of higher share cities follow a pattern - they are either fast growing, expensive, or cities that were hit particularly hard with foreclosures.

While the rental share of all real estate listings has gone up by about a third since the foreclosure crisis and may have exacerbated the shortage of for-sale homes, a high share of rental inventory doesn't necessarily translate to an adequate supply - it's all relative. In Austin for example, the more than 20 percent rental share was of a small overall inventory and the city had only a 1.7-month supply of homes for rent. In March of this year 17 of the 48 markets had a rental share less than the U.S. average of 4.5 months. Figure 4 illustrates that the month's supply of rentals has also declined from post-crisis levels.
Low levels of supply put upward pressure on the cost of both for-sale and for-rent homes. Home prices, while increasing at a slower pace over the past year, are still rising, as are single-family rents.


