
Home flipping, buying a property with the intent to sell it in a short period of time at a profit, is more popular than almost ever, but a study by CoreLogic finds it has morphed into a different kind of business. Flippers are tending to hold on to property longer, and to add value rather than relying only on rates of appreciation.
For the purposes of its study on the subject, CoreLogic used a two-year period to define a flip rather than the 12-months commonly employed. It did this to match the Internal Revenue Service's threshold for when real estate holdings can be considered owner-occupied and thus eligible for those capital gains exceptions. The longer holding period also makes a property eligible for the long-term rather than the higher short-term capital gains tax rate.
Flipping has been increasing steadily for the past eight years and higher year-over-year for the last 12 quarters. In the fourth quarter of 2018 flipping accounted for 10.6 percent of all home sales, the highest for a fourth quarter since CoreLogic started tracking it in 2002. Flipping is seasonal, so the fourth quarter rate was slightly lower than the 11.1 percent record earlier in the year.*
Even as the rate of flipping has risen, so too has profitability. CoreLogic measured the returns on a flip on an annualized basis, taking into consideration the opportunity costs of a flip (price growth of similar houses that weren't part of a flip) any market discount the flipper received on the purchase, and any premium received on the sale. It does not take into consideration the capital expenses of renovation or repairs, so what the study calls the "economic returns" represents their upper limits. Nationally the median annualized return on a sale was 40 percent in the fourth quarter.
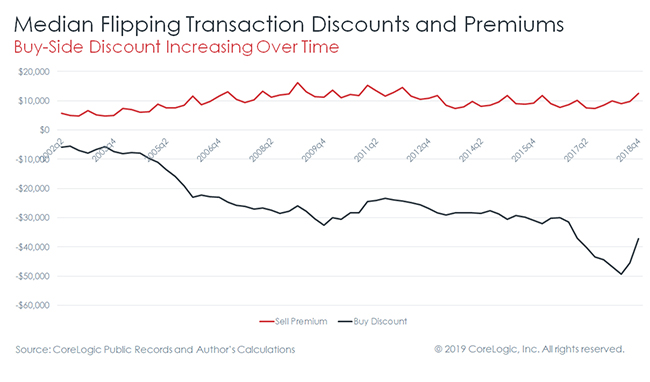
Ralph McLaughlin, writing in the CoreLogic Insights blog says by combining the company's public records data with their own statistical models they could estimate the discount a flipper received when purchasing a property and the premium received when it was sold. Along with market appreciation, those are the three ways a flipper can make a profit.
McLaughlin points out that in the early 2000s the average flipper didn't make much from either the discount or the premium, apparently relying more on speculation and rising prices to achieve a return. However, since the Great Recession they have become increasingly good at acquiring properties at a discount because they were legally, financially, or physically distressed while the selling premium remained relatively constant. This suggests a new business model - rather than speculating, flippers are adding value. This means their investments are more sustainable over time.
While CoreLogic uses the two-year definition of flipping, they also look at how other measures have trended over time. The chart below shows that the activity level of short term (6-months or less) flippers has remained relatively constant, it has been fluctuations in activity among longer term flippers that has driven the overall level of activity. This could from a combination of reasons.
- Rising prices during a housing market expansion encourages more complicated and time-consuming flips.
- Less experienced flippers jump in and can't turn the property around as rapidly as the veterans.
- Tax-incentives encourage flippers to hold onto properties longer.

Using the two-year definition, CoreLogic found sharply different flipping rates geographically. While not a perfect fit, the rates are highest in Sunbelt metro's and lowest in those in the Rustbelt. For example, eight of the ten top metros for flipping, with rates ranging from 16.5 percent of sales down to 13.8 percent were in the Sunbelt (Birmingham, Memphis, Tampa, Las Vegas, Phoenix, Palm Bay and Lakeland, Florida; and Atlanta.) The other two, in the middle of the pack, were Camden and Philadelphia. At the low end, with rates in the 4 to 7 percent range were four New England metros, and four in the Rustbelt. Only two Sunbelt cities, Austin and Houston, were in the bottom ten.
McLaughlin says flipping returns have been on a wild ride during the sixteen years CoreLogic has tracked them. From 2002 to 2007 both economic returns and annualized economic returns (the latter of which controls for the length of a flip) hovered around 4-5 percent. Because closing costs when selling a home are anywhere from 5-8 percent, these findings suggest that the only other way that flippers were trying to make money was by speculating on home value appreciation which is excluded from the economic return calculation.
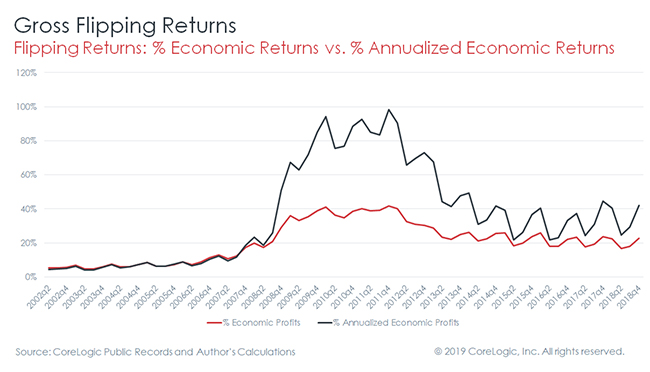
After 2007 returns skyrocketed to a median of around 40 percent, and near 100 percent when annualized. This was probably because there were many distressed properties available at deep discounts and flippers could quickly resell them for a profit. That this was happening is further illustrated by the divergence between annualized and non-annualized returns and that the median holding period decreased from over 300 days in the mid-2000s to just under 200 during the foreclosure crisis.
There is also substantial variation in various markets when it comes to economic returns, but in this case it is the Rustbelt markets that are on the high end while Sunbelt metros have the lowest returns. Detroit, Philadelphia, and Pittsburgh had returns of 95.9, 92.8, and 75 percent, respectively. The other seven markets with the highest economic returns were in Ohio, Maryland, Delaware, Wisconsin, and New York. Returns in these areas ranged between 58.9 and 70 percent.
The low end returns tend to be in areas with newer housing stock, for example, Raleigh, Colorado Springs, and Charlotte, with returns of 5.1, 7.7, and 7.8 percent, respectively. The other seven markets with the lowest economic returns to flipping are in Arkansas, Missouri, Texas, Arizona, and Tennessee, Florida, and Nevada, with returns ranging between 8.4 and 10.8 percent, respectively.
The relationship between the age of homes flipped and economic profits are strong. Sixty-four percent of the variation in economic profits among metro areas can be explaned by the age of the homes flipped. However, this does not mean there are more net profits to be made in older markets, more likely it is the contrary. The economic return model does not include the capital to bring homes up to standard which is likely to be higher with older homes.
There is also evidence that more experienced professional flippers have entered the market which might be driving the trend away from speculation. The share of flipped homes that were sold by a business entity such as an LLC reached 41.2 percent in the third quarter of 2018 from a low of 11.4 percent in the same quarter of 2005.
*In other words, this is why flipping has the highest market share that CoreLogic has ever recorded, even though the chart makes 2006 look higher. If we were only looking at 4th quarter vs 4 quarter for any given year, 2018 wins. Thus, the 1st quarter of 2019 stands a good chance of being higher than the 1st quarter of 2006.


