CoreLogic says its Home Price Index (HPI) for February reflected an increase of 0.7 percent from January to February and that home prices nationwide were up by 4.0 percent. The monthly gain was higher than in January (up 0.1 percent), perhaps reflecting the approaching spring market, but there is definite deceleration on an annual basis. In February the year-over-year change was 4.0 percent, down from 4.4 percent in January and significantly lower than the February 2017 to February 2018 change, 6.7 percent.
North Dakota was the only state that did not have an annual increase in home prices. The largest gains were in Idaho (10.2%), Nevada (8.9%) and Utah (8.7%).
Frank Nothaft, CoreLogic's chief economist commented, "During the first two months of the year, home-price growth continued to decelerate. This is the opposite of what we saw the last two years when price growth accelerated early. With the Federal Reserve's announcement to keep short-term interest rates where they are for the rest of the year, we expect mortgage rates to remain low and be a boost for the spring buying season. A strong buying season could lead to a pickup in home-price growth later this year."
In a survey conducted during the first quarter of this year 62 percent of respondents living in "high priced" markets said that housing in those markets was unaffordable, a response given by only 11 percent of those surveyed across all markets nationwide in the first quarter of 2018. Renters responded similarly, with nearly three quarters (71 percent) of those in the high-priced markets calling housing costs unaffordable compared to 16 percent of renters across all markets last year. High-priced markets were identified as the 15 metropolitan areas with the highest median home prices.
CoreLogic says 35 percent of the country's 100 largest metropolitan areas were "overvalued" in February. Twenty-seven percent were "undervalued", and 38 percent were "at value." The CoreLogic analysis looks at individual markets and their long-run sustainable prices supported by underlying fundamentals such as disposable income. The analysis defines an overvalued housing market as one in which home prices are at least 10 percent higher than the long-term, sustainable level, while an undervalued market is one in which home prices are at least 10 percent below it. Among the top 50 markets based on housing stock, 40 percent were overvalued, 18 percent were undervalued, and 42 percent were at value.
CoreLogic President and CEO Frank Martel said, "About 40 percent of the top 50 largest metropolitan areas in the country are now categorized as overvalued and we expect that percentage to grow over the remainder of 2019. The cost of either buying or renting in expensive markets puts a significant strain on most consumers. Our research tells us that about 74 percent of millennials, the single largest cohort of homebuyers, now report having to cut back on other categories of spending to afford their housing costs." Some of their choices include taking a roommate, cutting back on entertainment and/or eating out, or taking a second job/working longer hours.
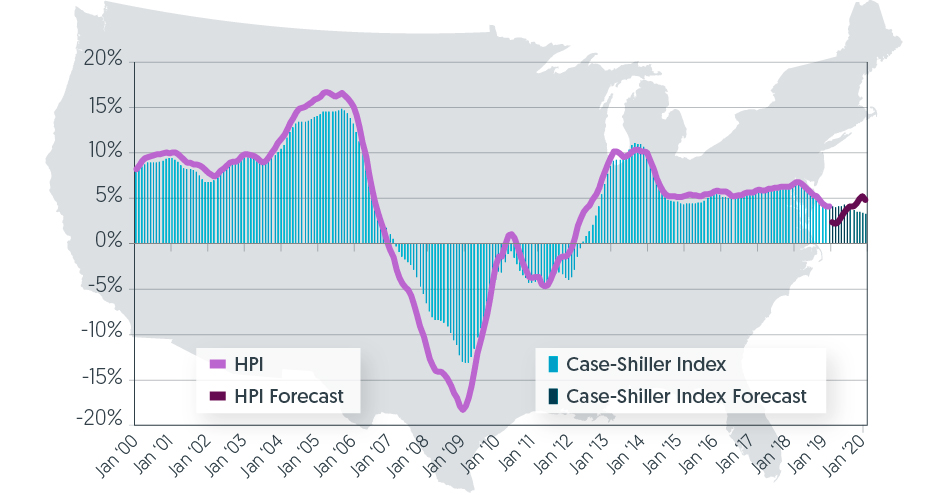
The company's forecast for future prices is a 4.7 percent gain from February 2019 to February 2020. On a month-over-month basis, home prices are expected to decrease by 0.5 percent from February 2019 to March 2019.
The CoreLogic HPI Forecast is a projection of home prices using the CoreLogic HPI and other economic variables. Values are derived from state-level forecasts by weighting indices according to the number of owner-occupied households for each state.
This graph below shows a comparison of the year-over-year percentage change nationwide for the CoreLogic HPI and CoreLogic Case-Shiller Index from 2000 to the present month along with forecasts one year into the future. Both the CoreLogic HPI Single Family Combined tier and the CoreLogic Case-Shiller Index are posting positive, but moderating year-over-year percent changes, and forecasting gains for the next year.