
Both the Federal Housing Finance Agency (FHFA) and the S&P CoreLogic Case-Shiller housing indices acknowledged further slowing in home price appreciation in December. The Case-Shiller National Home Price NSA Index, covering all nine U.S. census divisions, reported a 4.7% annual gain in December, down from 5.1 percent the previous month. Before seasonal adjustment, the National Index lost 0.1 percent compared to November and was up 0.3 percent after adjustment.
The 10-City Composite gain was 3.8 percent for the year, compared to an annual increase of 4.2 percent in November while the 20-City Composite's year-over-year appreciation slowed from 4.6 percent in November to 4.2 percent. Both Composites reported 0.2 percent decreases in December on an unadjusted basis and 0.2 percent increases after adjustment. Five of the 20 cities tracked reported increases before seasonal adjustment and 14 did so afterward.
Las Vegas and Phoenix again posted the top two year-over-year gains while Atlanta bumped Seattle out of third place. Las Vegas had an annual gain of 11.4 percent, Phoenix was up 8.0 percent and Atlanta's prices rose 5.9 percent. Three of the 20 cities reported greater price increases in the year ending December 2018 versus the year ending November 2018.
"The annual rate of price increases continues to fall," says David M. Blitzer, Managing Director and Chairman of the Index Committee at S&P Dow Jones Indices. "Even at the reduced pace of 4.7 percent per year, home prices continue to outpace wage gains of 3.5 percent to 4 percent and inflation of about 2 percent. A decline in interest rates in the fourth quarter was not enough to offset the impact of rising prices on home sales. The monthly number of existing single-family homes sold dropped throughout 2018, reaching an annual rate of 4.45 million in December. The 2018 full year sales pace was 4.74 million.
"Regional patterns continue to shift. Seattle and Portland, Oregon experienced the fastest price increases of any city from late 2016 to the spring of 2018; in December, they ranked 11th and 16th. Currently, the cities with the fastest price increases are Las Vegas and Phoenix. These are a reminder of how prices rose and collapsed in the financial crisis 12 years ago. Despite their recent gains, Las Vegas and Phoenix are the furthest below their 2006 peaks of any city followed in the S&P CoreLogic Case-Shiller Indices.
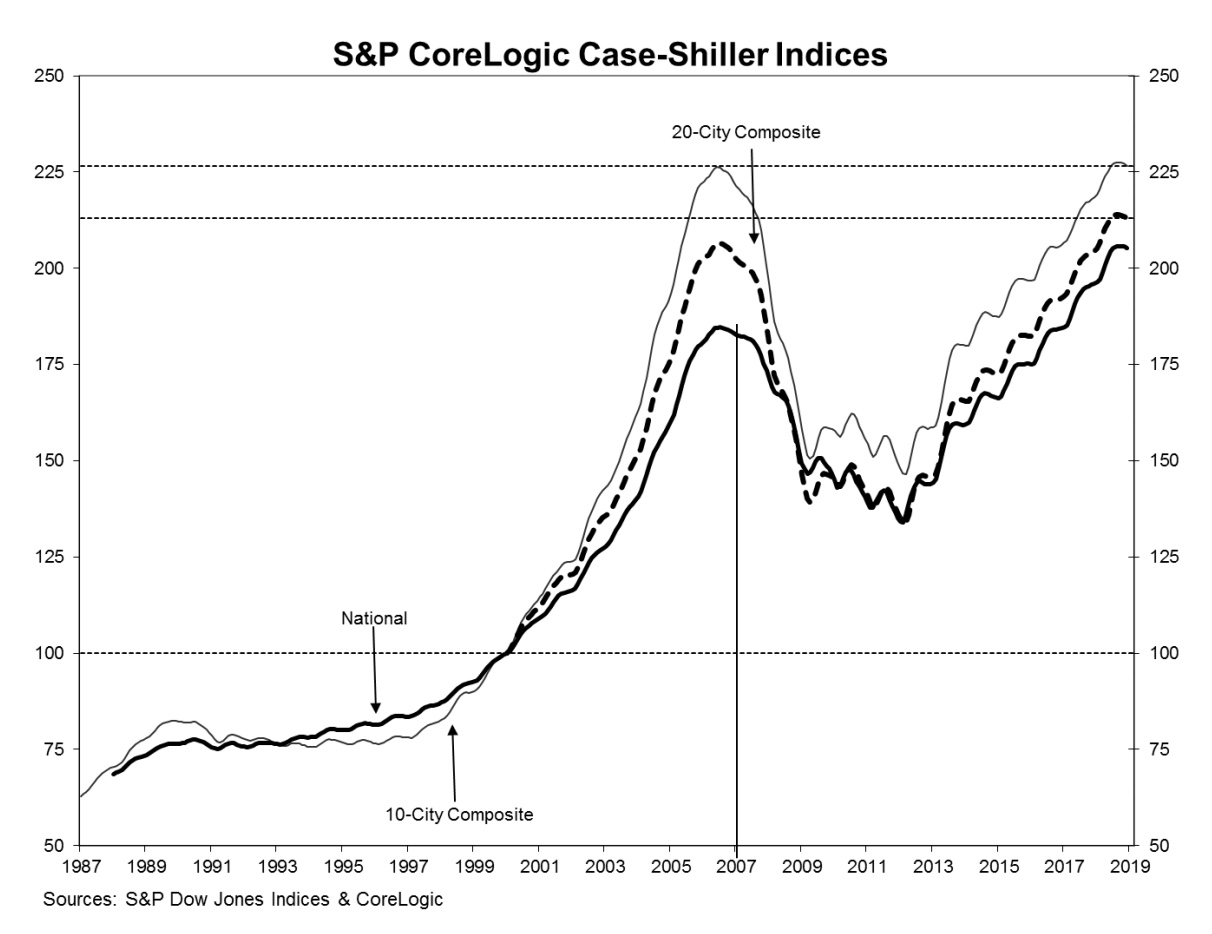
Nationally prices are now 11.2 percent higher than their previous July 2006 peak and have risen 53.2 percent since hitting their crisis trough in February 2012. The 20-City Composite is 3.1 percent and the 10-City Composite is 0.1 percent higher than their prior respective peaks. Average home prices for the MSAs within the two composites are back to winter 2007 levels.
FHFA is reporting both December 2018 and fourth quarter results for its House Price Index (HPI). It sees higher, but still decelerating prices than does the S&P Case Shiller report. On a quarter-over-quarter basis prices rose 1.1 percent in the fourth quarter and were 5.7 percent higher than in the fourth quarter of 2017. The fourth quarter 2017 HPI was up 6.7 percent from its prior year. The seasonally adjusted HPI was 0.3 percent higher than in November, the same reported gain as the Case-Shiller National Index.

"House prices rose throughout 2018 but at a slower rate than in recent years," said Dr. William Doerner, FHFA Supervisory Economist. "In the fourth quarter, house price appreciation hit one of the lowest levels in the past four years."
Home prices rose year-over-year in all 50 states and the District of Columbia. The greatest gains were in Idaho, up 11.9 percent; Nevada, 11.2 percent; Utah, 9.8 percent; and Georgia and Arizona each posting 8.2 percent gains. Prices were also rose in 98 of the 100 largest metropolitan areas.
The Mountain division experienced the strongest four-quarter appreciation of the nine census divisions at an 8.1 percent gain between the fourth quarters of 2017 and 2018 and a 1.6 percent increase in the fourth quarter of 2018. Annual house price appreciation was weakest in the West South Central division, where prices rose by 4.3 percent between the fourth quarters of 2017 and 2018.
FHFA's HPI tracks changes in home values for individual properties owned or guaranteed by Fannie Mae or Freddie Mac over the past 43 years using more than eight million repeat transactions. The Index was benchmarked at 100 in January 1991 and now stands at 270.2.
The S&P CoreLogic Case-Shiller Home Price Indices are constructed to accurately track the price path of typical single-family home pairs for thousands of individual houses from the available universe of arms-length sales data. The National U.S. Home Price Index tracks the value of single-family housing within the United States. The indices have a base value of 100 in January 2000; thus, for example, a current index value of 150 translates to a 50 percent appreciation rate since January 2000 for a typical home located within the subject market.
As of December 2018, the National Index was at 205.35, down from 205.83 in November. The 10- and 20-City Composites had readings of 226.61 and 212.96 respectively, compared to 227.42 and 213.66 in November. Los Angeles claims the highest index at 281.66 and Cleveland the lowest at 122.47.


