
Households headed by self-employed persons make up about one-tenth of all households and have a median income higher than those headed by salaried persons. But, while both self-employed and salaried households were hit hard by the Great Recession, the self-employed were hit harder and have not yet fully recovered from those effects. Those households also find it more difficult to obtain a mortgage than salaried individuals because they are harder to underwrite. They experience greater income volatility and lack pay stubs or W-2s that make it easy for lenders to verify and document income.
Three Urban Institute researchers, Karan Kaul, Laurie Goodman, and Jun Zhu used American Community Survey (ACS) data from 2001 to 2016 to determine the size of the self-employed population, their incomes, homeownership rates and mortgage use compared to salaried households.
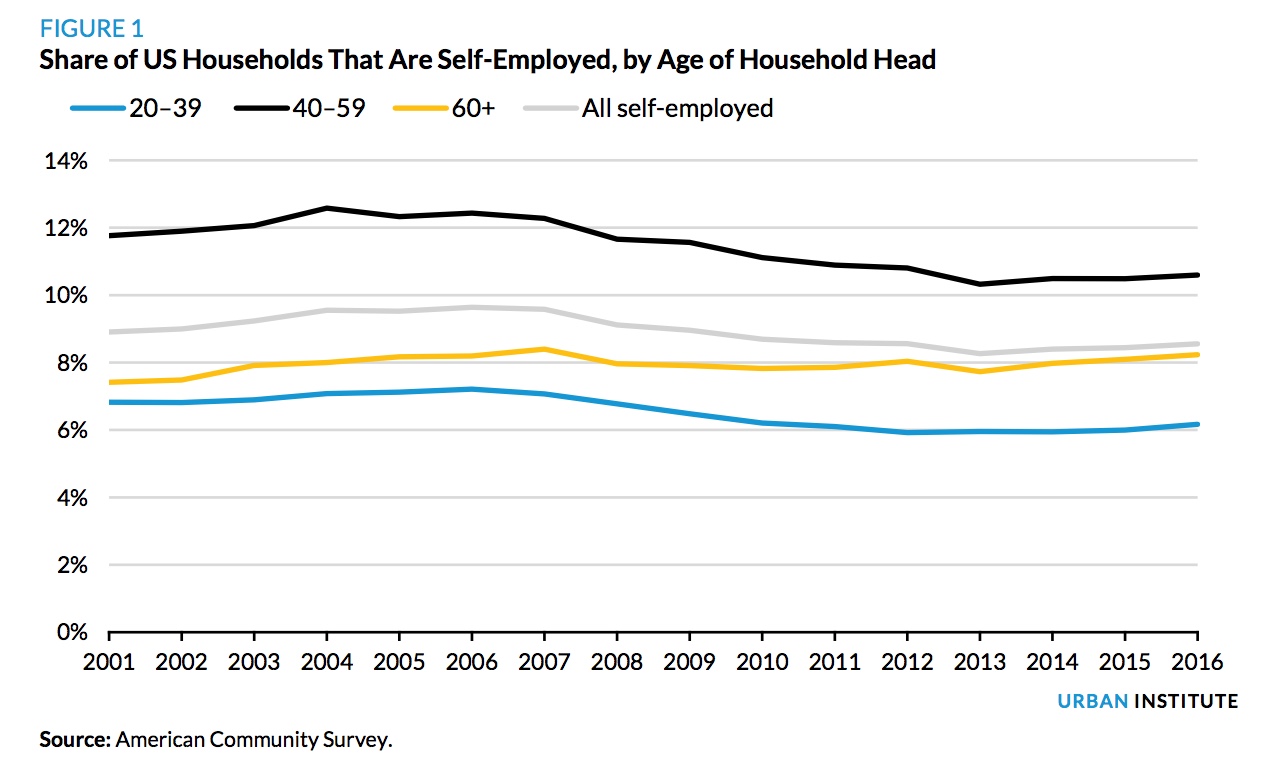
The three found about 8.5 percent of households were headed by a self-employed person in 2016, and another 3.4 percent were salaried but had some self-employment income. This number is down from the pre-recession years when the self-employment number was increasing - from 8.9 percent in 2001 to 9.6 percent in 2006. It bottomed out at 8.3 percent in 2013, declining in every age group. By 2016, the largest share was among household heads aged 40 to 59, 10.6 percent.
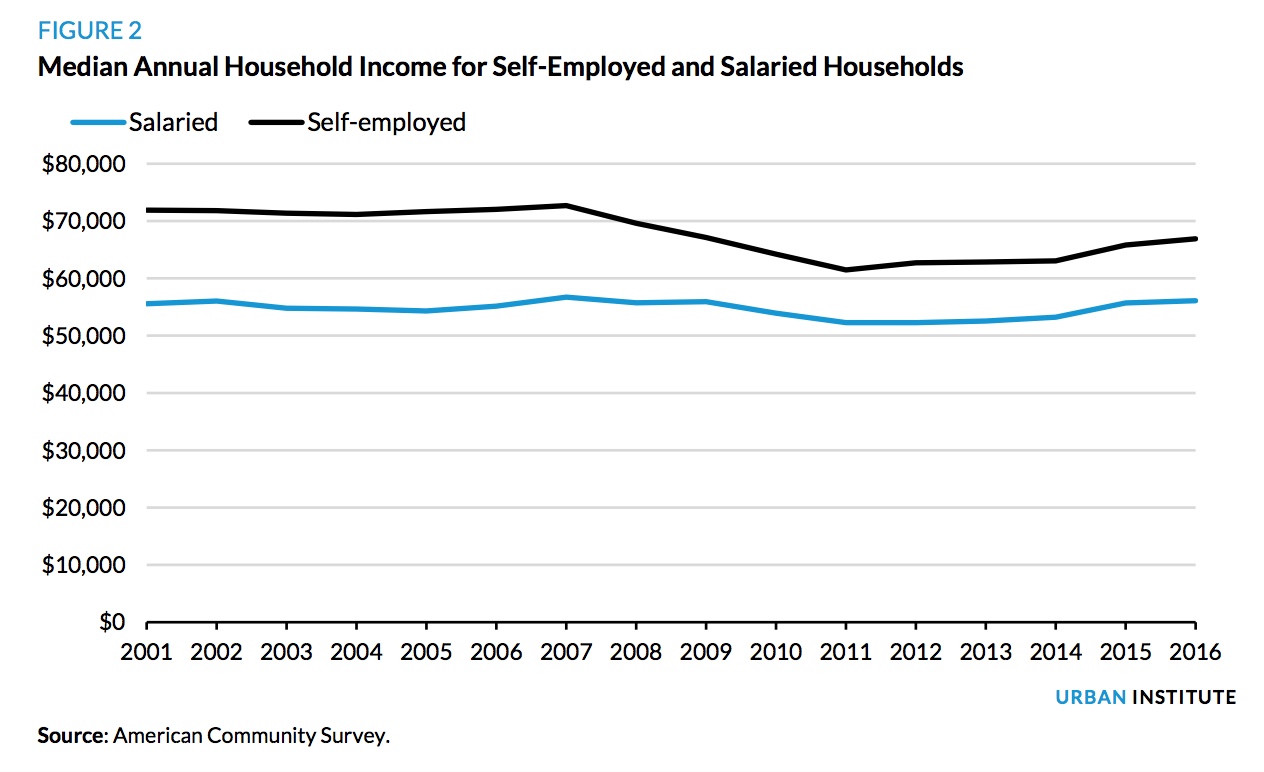
The incomes of both self-employed and salaried households took a hit during the recession, but the former was hit harder. In 2007 the median annuHal income among self-employed was roughly $16,500 higher than salaried households at $71,800. By 2011 the differential had fallen to $9,200. By 2016 median salaried income had almost recovered to pre-crisis levels at $56,100 while self-employed households earned a median $66,900, the gap shrinking to $10,800.
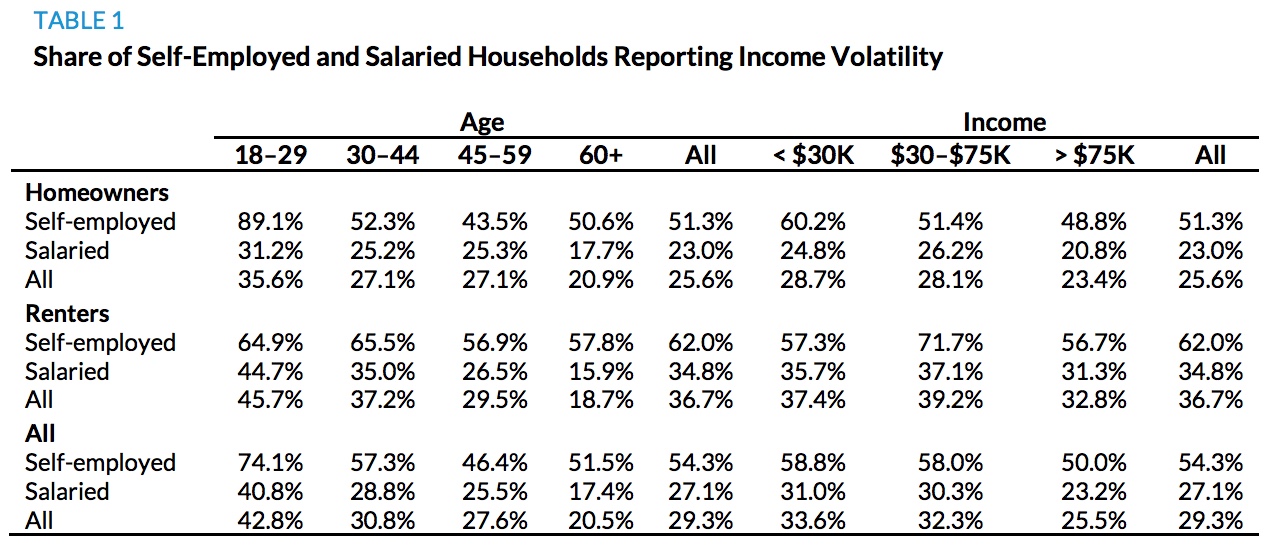
Even though the self-employed have higher median incomes, they are much more likely to report month-to-month income variation. Table 1 shows the number of earners, both renters and homeowners, who reported substantial variability, even if occasional, in their income across the year. The variability is the greatest among the younger age groups and those with the lowest incomes
With their higher incomes, self-employed households have had higher homeownership rates than salaried households since at least 2001. Between then and 2007 the self-employed homeownership rate averaged 13.4-points higher than the salaried rate. Then it fell for both groups (and for all demographic groups - to the lowest on record in 2016.) But homeownership among the self-employed went from 79.2 percent to 72.9 percent while the salaried homeownership rate went declined less, from 65.8 percent to 62.7 percent, despite the higher incomes of the self-employed.
Mortgage use also declined more among the self-employed households. The authors measured this by looking at the share of new homebuyers in each year who had a mortgage. Before 2007, self-employed households who purchased a home were almost as likely to carry a mortgage as salaried household homebuyers- about 80 percent in each category. Mortgage use declined for both groups after 2007, but 67 percent of self-employed households that purchased a home in 2016 had a mortgage while 74 percent of salaried home purchasers used one. Self-employed mortgage use declined 13 percentage points compared with 6 percentage points for salaried households over the same period.

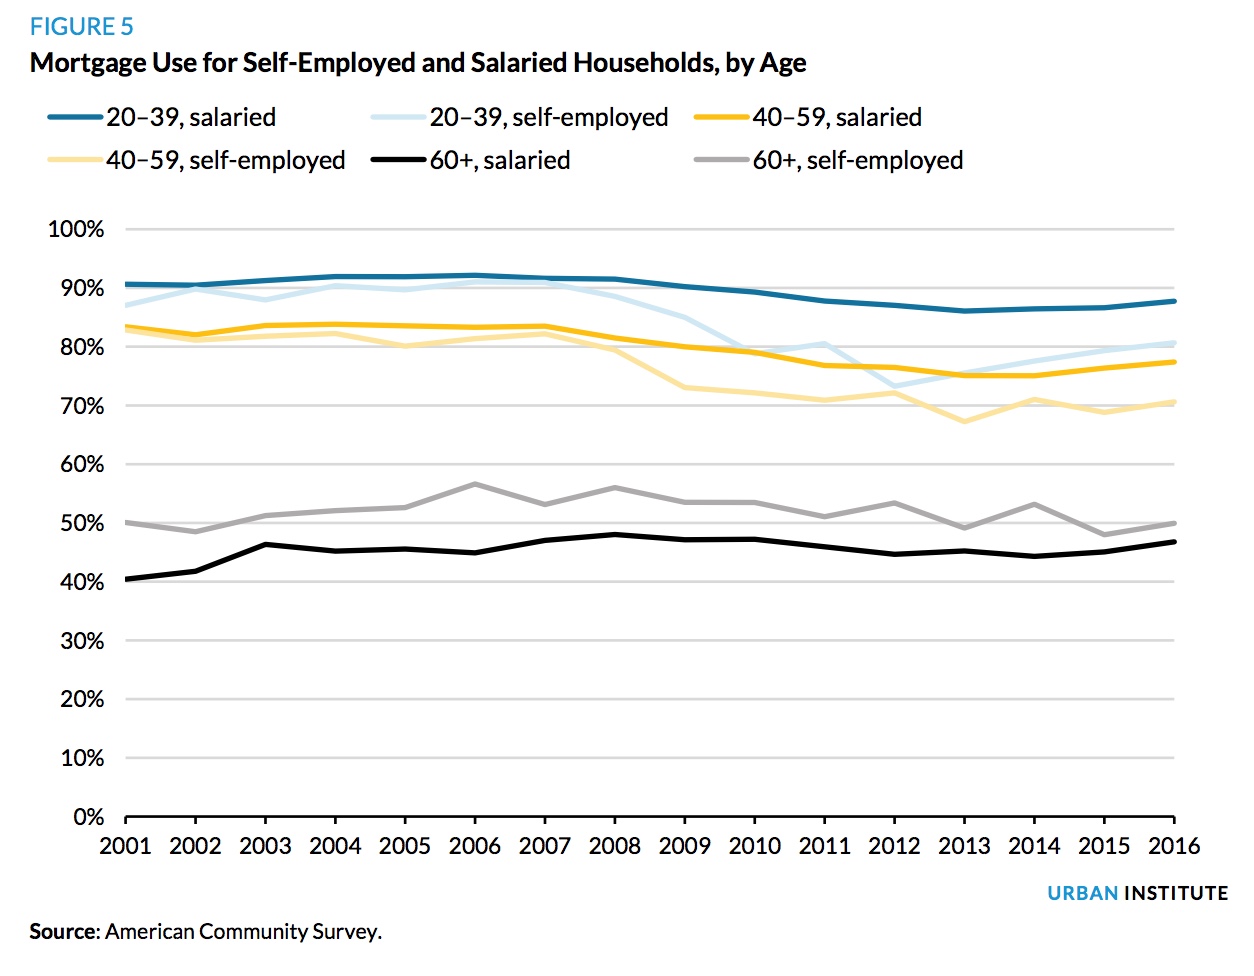
Dividing the two types of households by age buckets (20 to 39, 40 to 59, and 60 and older) shows declines of mortgage use among all six groups with households ages 60 and older being the least affected. In the other two age groups it was the self-employed with the larger declines. Before 2007, mortgage use for 20-to-39-year-old self-employed households was only marginally less than for salaried households (both close to 90 percent). By 2016, however, mortgage use for self-employed households had fallen to 80.6 percent, while mortgage use for salaried households had fallen to 87.7 percent. Thus, the self-employed in the prime homebuying ages (20 to 59) are those whose likelihood of having a mortgage has fallen the most.
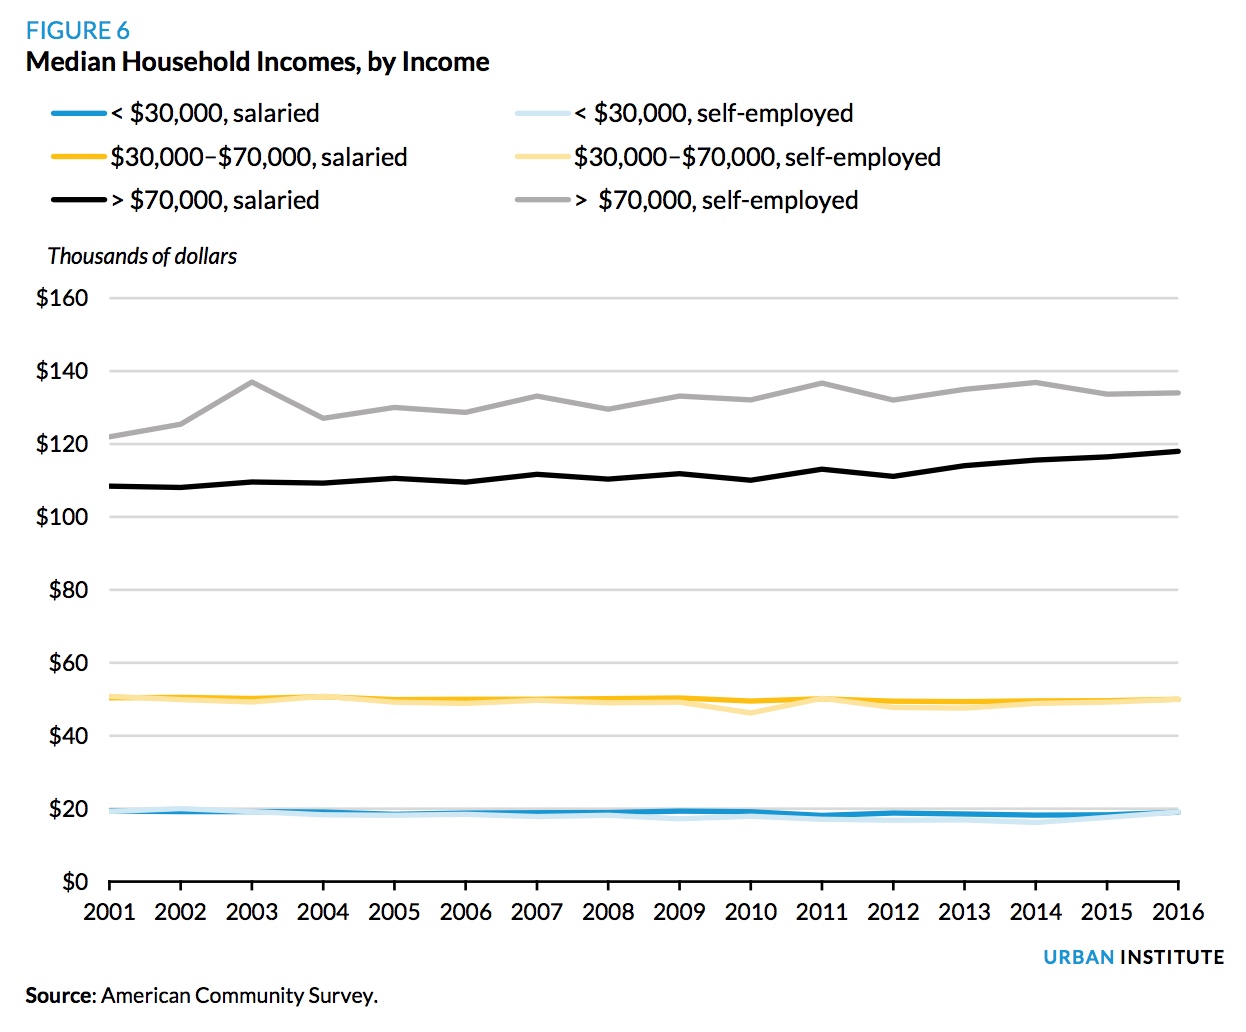
The authors say that the larger declines in the homeownership rate and mortgage use for the self-employed partly reflects the fact that their incomes fell more during the recession which, all else being equal, would make it more difficult to qualify for a mortgage. But they say a "more nuanced picture emerges" when income is held constant. Putting income into buckets rather than looking at discrete numbers shows that median incomes within the buckets have been either flat or modestly higher over time. This reflects the changing composition of households in each bucket. That is, as incomes fell during the recession, many households dropped out of a higher income bucket and fell into a lower one.
But for households in the highest bucket, $70,000+ per year, median incomes did not decline materially or at all. Self-employed households in this bucket earned a median annual income of $133,000 in 2007 versus $134,000 while salaried households earned $111,700 in 2007 and $118,000 in 2016.
The authors then used the same income buckets to show the homeownership rates and mortgage use between of the two types of earners. Both variables declined for both types of households post-crisis despite the fact the median incomes did not fall in any income bucket.
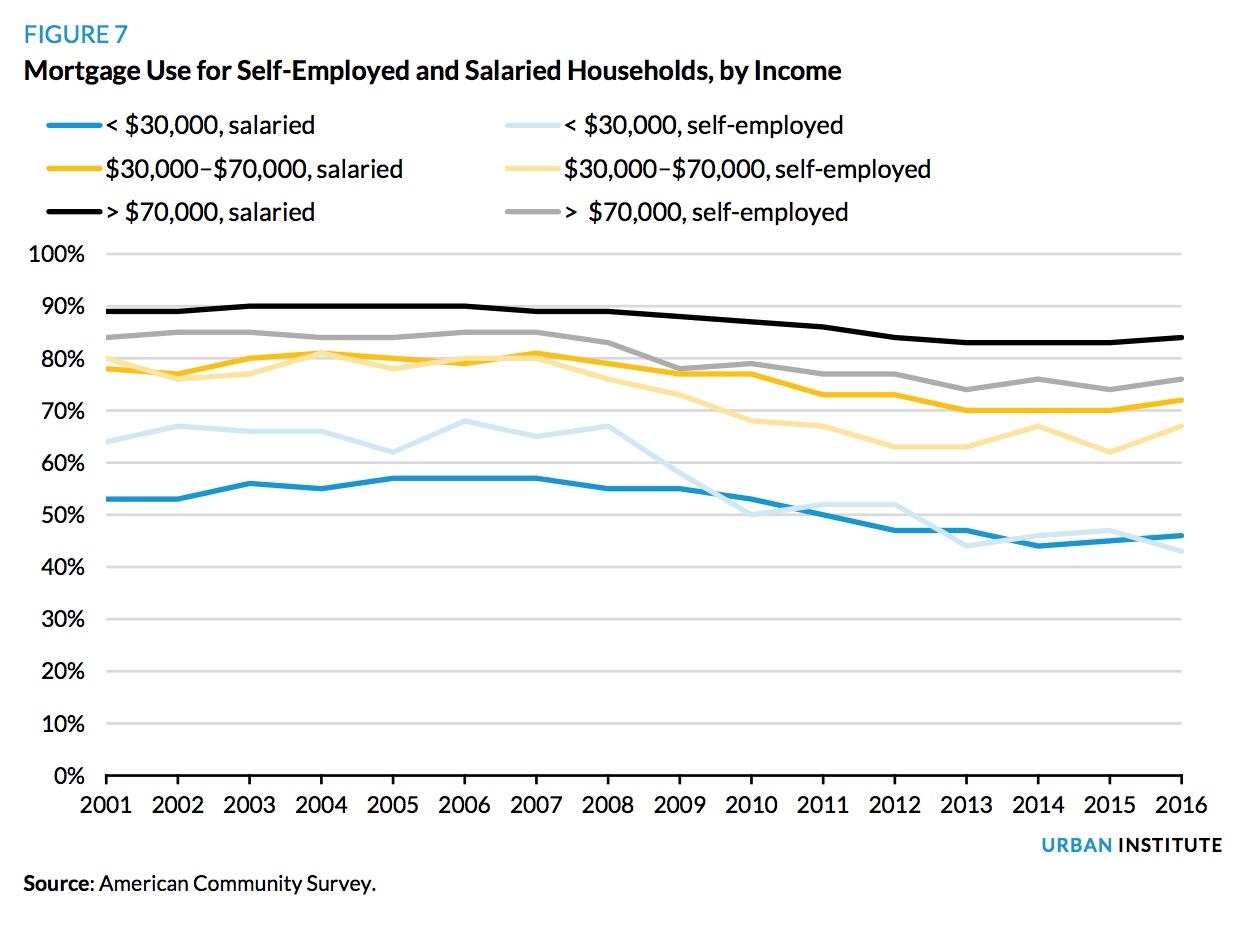

In addition, the declines were bigger for self-employed households. Among the largest earners, those most likely to have the resources to obtain and sustain homeownership, mortgage use for salaried households fell from 89 percent to 84 percent, between 2007 and 2016; for self-employed households, it fell from 85 percent to 76 percent, declines of 5 points and 9 points respectively. The homeownership rate for salaried households decreased to 79 percent from 84 percent and for self-employed households from 90 percent to 85 percent, 5 points in both cases. Similar trends are visible in the other two income buckets.
In sum, the larger decline in each income bucket of mortgage use and the homeownership rate for self-employed households in the face of stable median incomes suggests that other factors such as credit access are at play and have affected the self-employed more adversely.
The Bureau of Consumer Financial Protection (BCFP) is required by its enabling legislation to assess and report on the effectiveness of its qualified mortgage rule by January 2019. The authors say their study adds further support to the growing recognition that the mortgage market is not adequately meeting the lending needs of self-employed households.
Although those households continue to earn higher incomes than salaried ones the results of the analysis reflect that, at any income level, both mortgage use and the homeownership rate for self-employed households have declined more than they have for salaried households. This suggests that factors beyond income, such as tougher mortgage availability or requirements of appendix Q to the BCFP's qualified mortgage rule are likely at play.


