
The views about the direction of home prices diverged slightly in September, as those reported in the S&P CoreLogic Case Shiller indices slowed for the second month in a row while those from the Federal Housing Finance Agency (FHFA) for both September and the third quarter mostly kept chugging along.
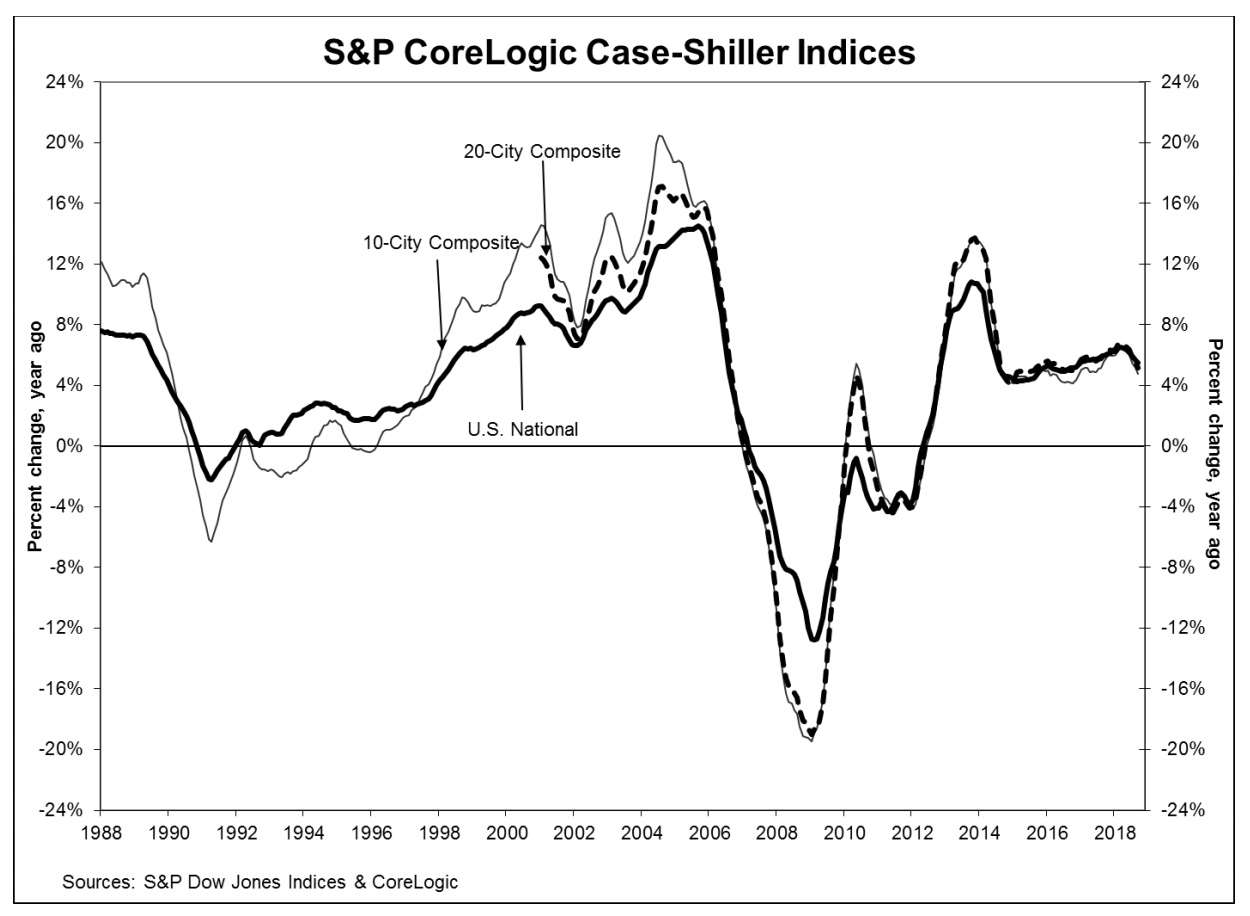
The Case-Shiller National Home Price index which covers all nine U.S. census divisions slowed from a 5.7 percent increase in August to 5.5 percent. On a non-seasonally adjusted basis the index gained 0.1 percent and was up 0.4 percent after adjustment. The monthly appreciation in August was reported at 0.2 percent unadjusted and 0.6 percent afterward.
The slowing was not as evident in the two city composite indices. The 10-City posted an annual increase of 4.8 percent, down from 5.2% the prior month and the 20-City declined from 5.5 percent to 5.1 percent. Neither composite posted a gain on a non-adjusted basis, the second month that those numbers were unchanged, but both were up 0.3 percent when adjusted, an acceleration from August's 0.1 percent gain.
Analysts polled by Econoday projected that the annual increase in the 20-City Composite would be 5.3 percent. The forecast for the seasonally adjusted monthly gain was 0.3 percent.
Las Vegas, San Francisco and Seattle reported the highest year-over-year gains among the 20 cities with Las Vegas again leading the way at 13.5 percent. San Francisco's prices rose 9.9 percent and Seattle posted 8.4 percent annual appreciation. Four of the 20 cities reported greater price increases in the year ending September 2018 versus the year ending August 2018.
David M. Blitzer, Managing Director and Chairman of the Index Committee at S&P Dow Jones Indices provided the following commentary.
"Home prices plus data on house sales and construction confirm the slowdown in housing," he said. "The S&P CoreLogic Case-Shiller National Index showed a 5.5 percent year-over-year gain, weaker for the second month in a row as 16 of 20 cities showed smaller annual price gains. On a monthly basis, nine cities saw prices decline in September compared to August. In Seattle, where prices were rising at double digit annual rates a few months ago, prices dropped last month. The few places reporting larger gains including some of the cities which had the biggest gains and largest losses 10 years ago: Las Vegas, Phoenix and Tampa.
"Sales of both new and existing single-family
homes peaked one year ago in November 2017. Sales of existing homes are down
9.3 percent from that peak. Housing starts are down 8.7 percent from November
of last year. The National Association of Home Builders sentiment index dropped
seven points to 60, its lowest level in two years. One factor contributing to
the weaker housing market is the recent increase in mortgage rates. Currently
the national average for a 30-year fixed rate loan is 4.9 percent, a full
percentage point higher than a year ago."
As of September 2018, average home prices for the MSAs within the 10-City and
20-City Composites are back to their winter 2007 levels. The National Index is now 11.5 percent above
its previous peak in July 2006 and has increased by 54 percent from its 2012
trough. Both of the composites have now
exceeded their previous 2006 highs, the 20-City by 3.5 percent and the 10-City
by 0.5 percent.
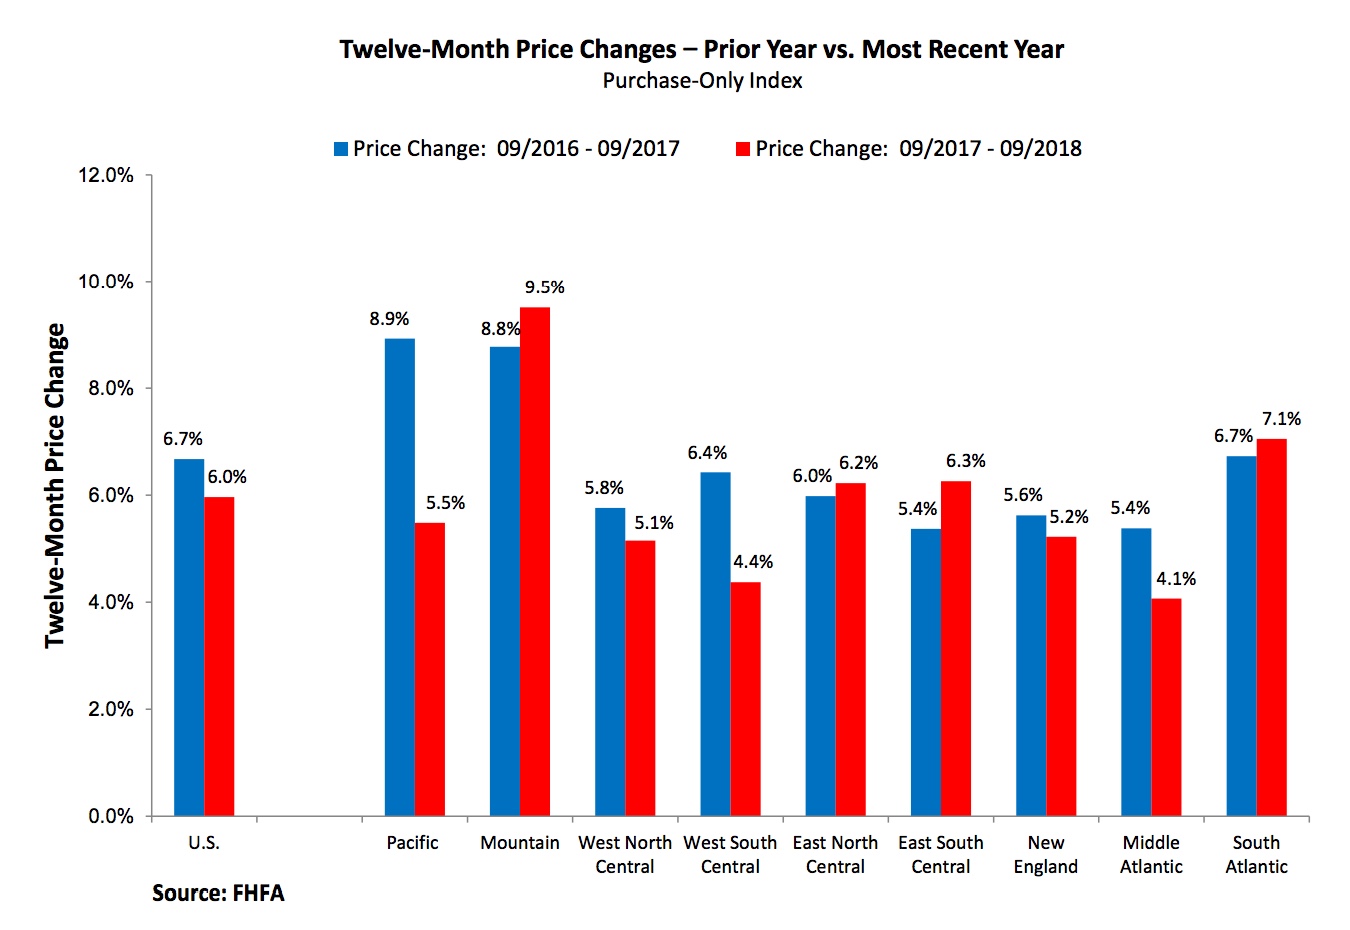
The FHFA's Housing Price Index shows a 6.3 percent gain in home prices nationwide since the end of the third quarter in 2017. The appreciation was most pronounced in the West with both Idaho and Nevada posting appreciation slightly exceeding 15 percent. Washington, Utah, and Colorado had increases of 10.6 to 9.2 percent. Home prices were up in 99 of the 100 largest metropolitan areas, most notably Boise, Idaho with a 20.1 percent increase.
FHFA said its month-over-month index was up 0.2 percent on a seasonally adjusted basis. That is down from the 0.4 percent increase posted for each of the previous five months.
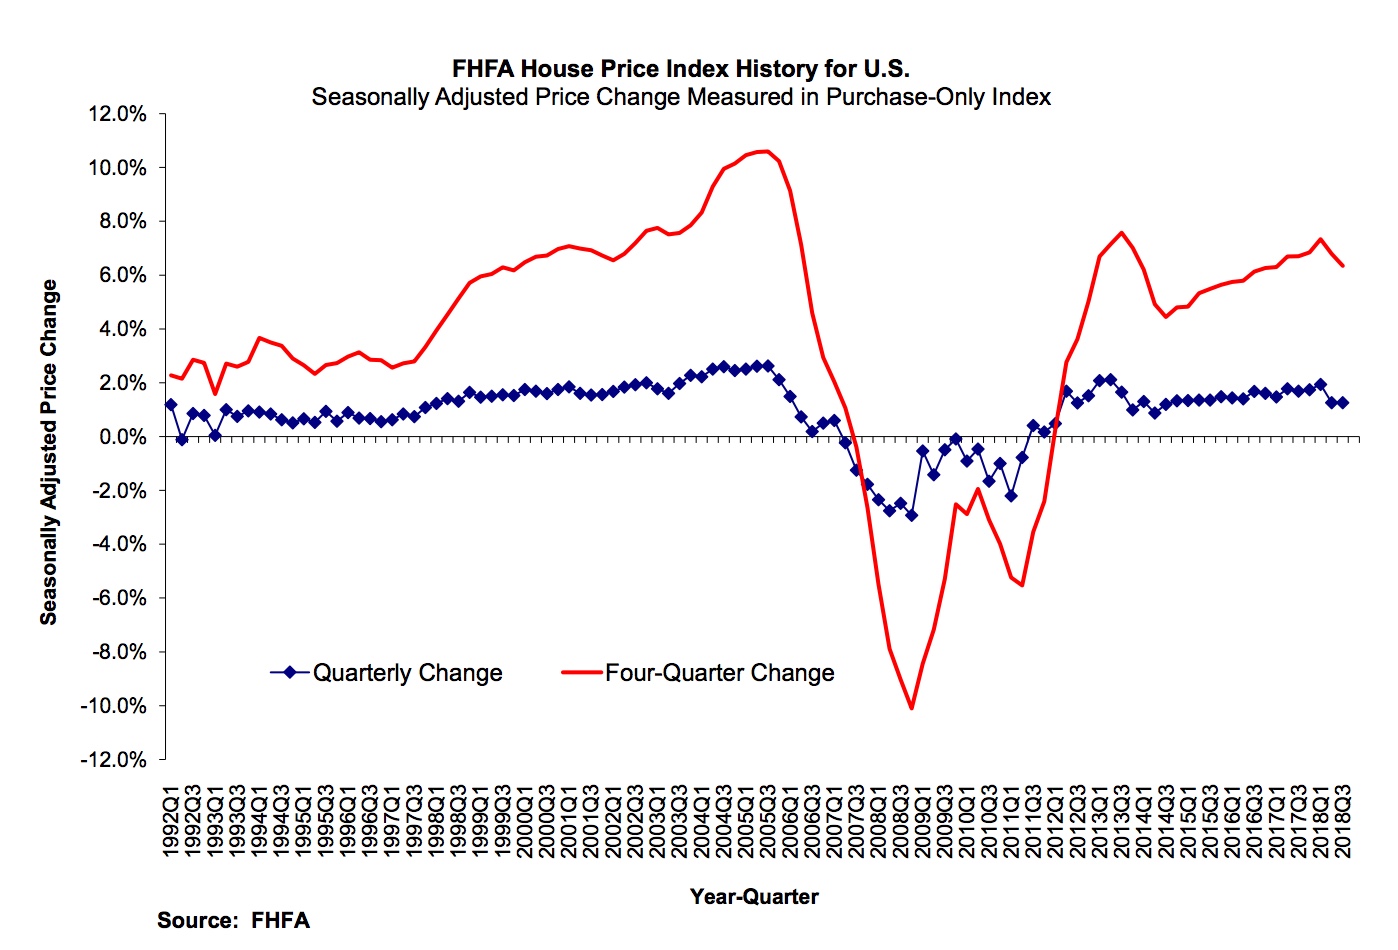
Of the nine census divisions, the Mountain division experienced the strongest four-quarter appreciation, posting an 8.9 percent gain between the third quarters of 2017 and 2018 and a 1.5 percent increase in the third quarter of 2018. Annual house appreciation was similarly weak in the New England, Middle Atlantic, and West South-Central divisions, where prices rose less than 5.0 percent between the third quarters of 2017 and 2018. Prices declined on a monthly basis in both the Pacific (-1.1 percent) and the West North Central (-0.1 percent) divisions.
The FHFA HPI is based on the purchase prices of homes sold with financing from Freddie Mac and Fannie Mae. The Index was benchmarked to 100 in January 1991. The September 2018 index reading was 266.9
The S&P CoreLogic Case-Shiller Home Price Indices are constructed to accurately track the price path of typical single-family home pairs for thousands of individual houses from the available universe of arms-length sales data. The National U.S. Home Price Index tracks the value of single-family housing within the United States. The indices have a base value of 100 in January 2000; thus, for example, a current index value of 150 translates to a 50 percent appreciation rate since January 2000 for a typical home located within the subject market.
The National Index set another new record in September, a reading of 205.82. August's peak was 205.81. The 10- and 20-City Composites had readings of 227.31 and 213.76 respectively. Los Angeles claims the highest index at 282.77 (a slight drop from August.) Cleveland had the lowest reading at 124.26.


