
The producers of the S&P CoreLogic Case-Shiller home price indices injected a dose of reality into their report for April. David M. Blitzer Managing Director and Chairman of the company's Index Committee sprinkled his analysis of yet another month of strong price appreciation with inflation data showing those gains are not on a par with those we saw pre-housing crash and thus perhaps not as worrisome as some might think.
All three of the indices softened slightly on an annual basis, The U.S. National Home Price Index, covering all nine U.S. census divisions, reported a 6.4 percent annual gain in April, a decline from a rate of 6.5 percent in the previous month. The last time year-over-year gains did not exceed 6.0 percent was July 2017. The a non-seasonally adjusted (NSA) National Index posted a month-over-month gain of 1.0 percent in April and after adjustment the increase was 0.3 percent.
The 10-City Composite annual increase came in at 6.2 percent, down from 6.4 percent in the previous month, and the 20-City Composite gained 6.6 percent year-over-year, compared to 6.7 percent in March. The monthly NSA gains were 0.6 percent for the 10-City and 0.8 percent for the 20-City. SA increases were 0.1 and 0.2 percent respectively. Nine of the 20 cities reported greater price increases in the year ending April 2018 versus the year ending March 2018 and monthly gains were reported by 10 of the 20 cities before seasonal adjustment and 17 afterward.
Seattle, Las Vegas, and San Francisco continue to report the highest year-over-year gains among the 20 cities. In April, Seattle led the way with a 13.1 percent year-over-year price change, followed by Las Vegas, up 12.7 percent and San Francisco with a 10.9 percent gain.
Blitzer said, "Home prices continued their climb with the S&P CoreLogic Case-Shiller National Index up 6.4 percent. Cities west of the Rocky Mountains continue to lead price increases with Seattle, Las Vegas and San Francisco ranking 1-2-3 based on price movements in the trailing 12 months. The favorable economy and moderate mortgage rates both support recent gains in housing. One factor pushing prices up is the continued low supply of homes for sale. The months-supply is currently 4.3 months, up from levels below 4 months earlier in the year, but still low."
However, his comments sought to put the continuing rate of appreciation in perspective. He said, "Looking back to the peak of the boom in 2006, 10 of the 20 cities tracked by the indices are higher than their peaks; the other ten are below their high points. The National Index is also above its previous all-time high, the 20-city index slightly up versus its peak, and the 10-city is a bit below. However, if one adjusts the price movements for inflation since 2006, a very different picture emerges. Only three cities - Dallas, Denver and Seattle - are ahead in real, or inflation-adjusted, terms. The National Index is 14 percent below its boom-time peak and Las Vegas, the city with the longest road to a new high, is 47 percent below its peak when inflation is factored in."
As of April 2018, average home prices for the metro areas within the 10-City and 20-City Composites are back to their winter 2007 levels. The National Index is now 8.8 percent above its previous peak in July 2006 and the 20-City Composite is 1.8 percent higher. The 10-City Composite lags behind its June 2006 peak by 1.1 percent.
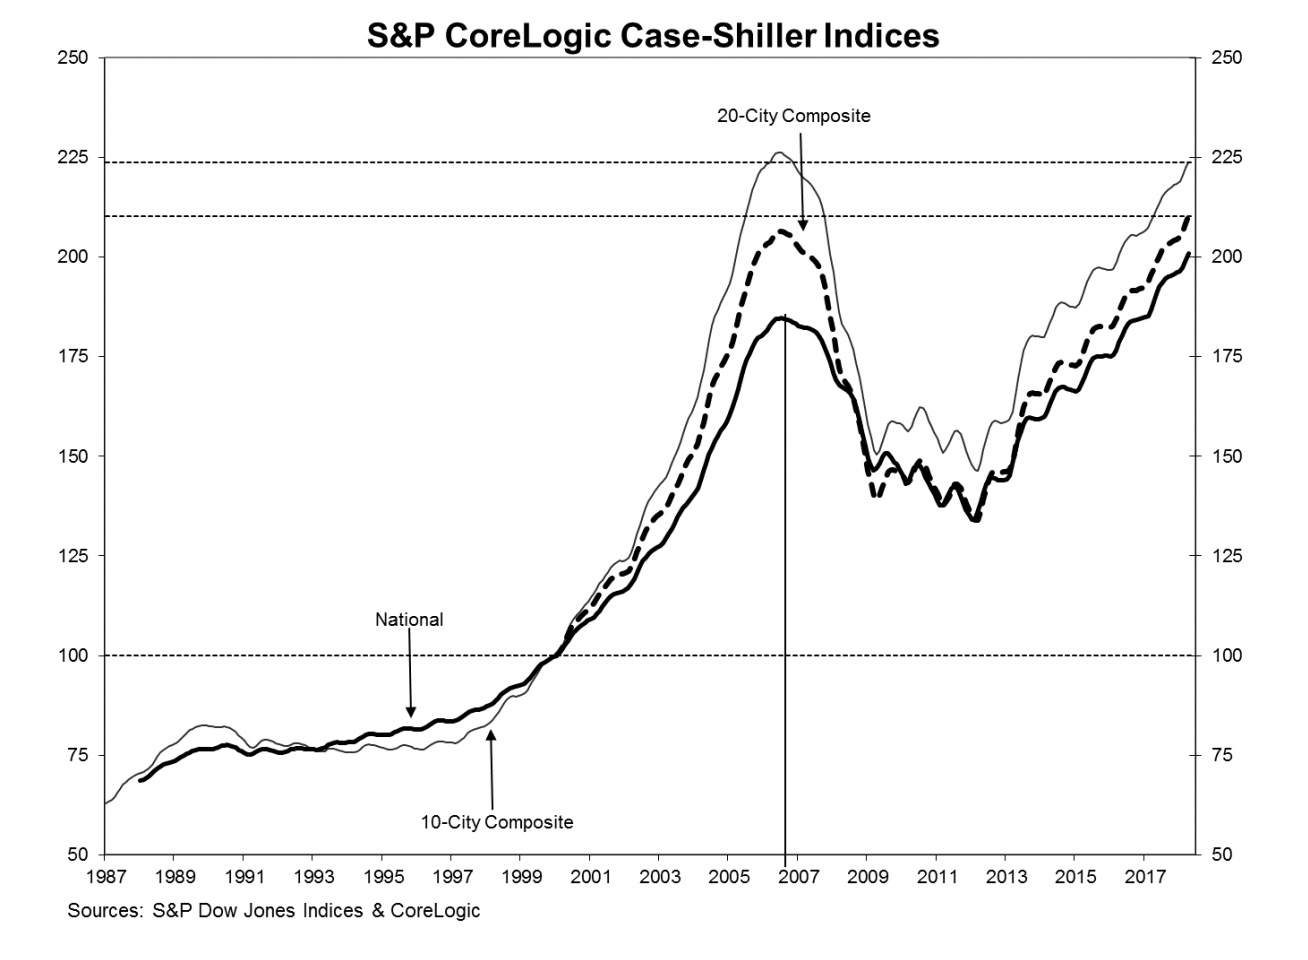
The S&P CoreLogic Case-Shiller Home Price Indices are constructed to accurately track the price path of typical single-family home pairs for thousands of individual houses from the available universe of arms-length sales data. The National U.S. Home Price Index tracks the value of single-family housing within the United States. The indices have a base value of 100 in January 2000; thus, for example, a current index value of 150 translates to a 50 percent appreciation rate since January 2000 for a typical home located within the subject market.
The National Index set another new record high in April, 200.86, up from the previous month's peak of 198.94. The 10- and 20-City Composites had readings of 223.70 and 210.17 respectively. Los Angeles claims the highest index reading at 280.44. Cleveland had the lowest reading at 119.13.


