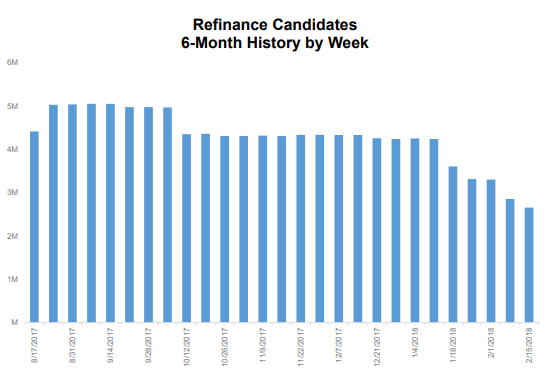
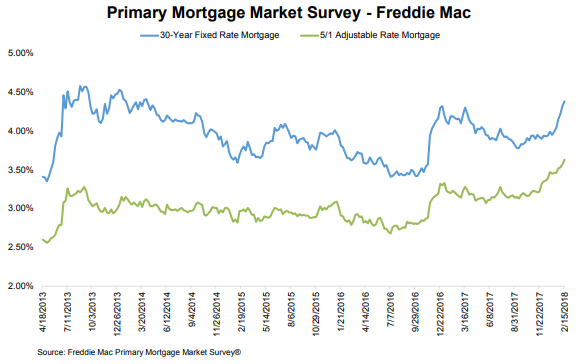
The refinance pool, homeowners who could benefit from exchanging their old first mortgage lien for a new one, is shrinking fast. Black Knight says, in its March Mortgage Monitor, that the pool declined by 40 percent from the beginning of the year through February 15. This happened as the average rate for a 30-year fixed-rate mortgage (FRM), per Freddie Mac, increased by 43 basis points to 4.38 percent. Since then rates have risen more slowly; they closed out last week at 4.43 percent. These increases put the average rate back to levels last reached in the spring of 2014.
These increase means that approximately 1.4 million borrowers lost the interest rate incentive to refinance in just the first six weeks of 2018. This leaves 2.65 million candidates who could benefit and are likely to qualify for refinancing at the higher cost level, the smallest pool since late 2008, just before the initial decline in interest rates that followed the start of the housing crisis.
The pool is still only down 10 percent from February 2017 following the late 2016 increases in rates, but Black Knight says rate/term refinancing is likely to be impacted more than this might suggest. The bulk of those homeowners who remain in the pool have loans from the older, pre-recession vintages. Fewer than 100,000 traditional refinance candidates, those with credit scores over 720 and loan-to-value ratios under 80 percent remain in 2012 and more recent loan buckets.
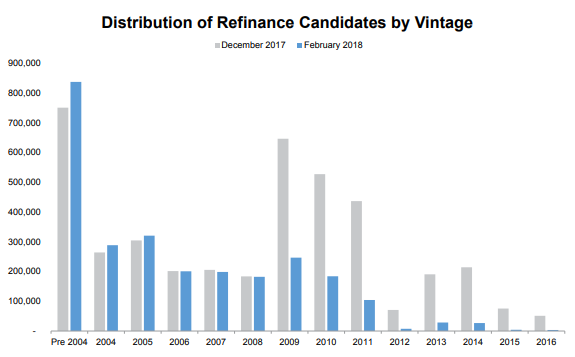
The number of candidates in older vintages has remained steady, even increasing in some cases, despite the recent rate increases. Black Knight says it expects to see growth in custom loan terms or term reduction refinances and that cash-outs will continue to dominate the refinance market. The market share for those looking to refinance out of mortgage insurance also has room for growth.
The introductory rate for adjustable rate mortgages (ARMs) has also gone up, in fact the 5/1 ARM began to increase even before the long term fixed rates. That rate has increased by 47 basis points since October. The delta between fixed and ARM products had increased to 75 basis points by mid-February, the highest in over two years.
Given the increasing delta and the tightening of affordability, it would not be surprising, the company says, to see the ARM share of mortgage lending go up as has historically been the case.
The impact of rate increases will, of course, be more pronounced for home buyers than refinancers. Along with the accompanying higher home prices, the cost to purchase a median home has jumped $67 per month in the first six weeks of the year. Overall, it costs $1,141 in monthly principal and interest to purchase using a 30-year FRM with 20 percent down. This is the largest monthly payment required since late 2008 and requires 23 percent of the median household income.
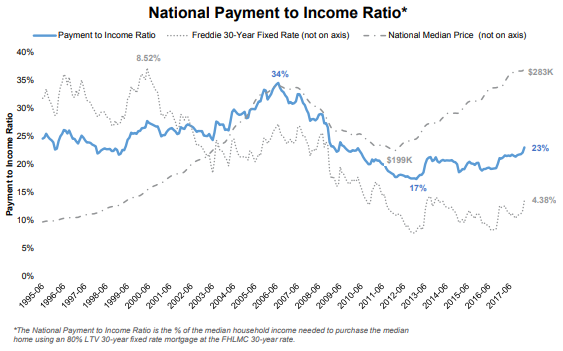
Black Knight says, however, that that overall affordability is still better than long-term historic averages. The current equation requires 1 percent less of the median income than in 1995 to 1999 and 3 percent less than in 2000 to 2003, and most notably, inn 2006 34 percent of income was required. Today, even though home prices have exceeded 2006 peaks, average incomes are more than 20 percent higher and interest rates are 2.3 percent lower.
Assuming all else remains equal, the company estimates that interest rates would have to climb north of 8 percent or the median home price to appreciate to $420 for affordability to be worse than at the 2006 pre-recession peak.
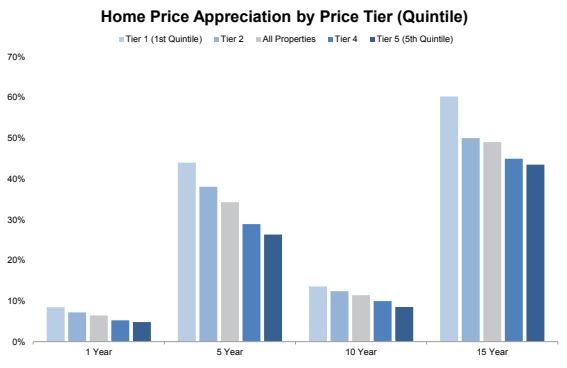
While affordability remains better than long-term averages nationally, home prices at the lower end of the market have been harder hit. As Black Knight Data & Analytics Executive Vice President Ben Graboske explained, "Prices on Tier 1 properties - those in the lowest 20 percent of home values - have been appreciating at a faster rate than all other tiers for 67 consecutive months. The annual rate of appreciation for these homes is 1.9 percent higher than the market average, and more than 3.6 percent higher than that of properties in the top 20 percent of prices (Tier 5).
"Larger overall increases in value among lower-priced homes is not just a recent trend, though; the same dynamic is observed when looking back over the past 15 years. While the nearly 50 percent increase in the median home price over that period has significantly outpaced the approximately 40 percent growth in the median income, lower interest rates today have more than offset that difference. However, according to Census Bureau data, income growth in the lower quintiles has not kept up with the higher ends of the market. This has clear implications for home affordability in this segment of the population, even more so in light of the 43 BPS increase in interest rates seen in just the first six weeks of 2018.