
Like one of those one-a-decade astrological anomalies, issuance of three home price reports for December along with a quarterly summary coincided today. As usual, S&P CoreLogic Case-Shiller, Black Knight, and the Federal Housing Finance Agency all posted different numbers reflecting their different universes and methodologies, but all showed, in the words of Case- Shiller's David M. Blitzer, that gains in housing may be leveling off.
The S&P CoreLogic Case-Shiller U.S. National Home Price NSA Index, covering all nine U.S. census divisions, reported a 6.3% annual gain in December, up from 6.1% in the previous month. The Index was 0.2 percent higher than in November before seasonal adjustment and 0.7 percent afterward.
The 10-City Composite Index rose 6.0 percent on an annual basis, the same rate of annual appreciation as in November, and the 20-City Composite was up 6.3 percent, easing 0.1-point easing from the previous month. Both Composites rose 0.2 percent higher unadjusted and 0.6 percent after adjustment. Twelve of the 20 cities reported increases in December before seasonal adjustment, while all 20 cities did so when adjusted.
Seattle continues to lead all the cities tracked by Case-Shiller. Its annual price increase in December was 12.7 percent. Las Vegas, and San Francisco follow with gains of 11.1 percent and 9.2 percent respectively. Nine cities reported greater price increases in the year ending December 2017 versus the year ending November 2017.
"The rise in home prices should be causing the same nervous wonder aimed at the stock market after its recent bout of volatility," Blitzer, Managing Director and Chairman of the Index Committee, said. "Across the 20 cities covered by S&P Corelogic Case Shiller Home Price Indices, the average increase from the financial crisis low is 62 percent; over the same period, inflation was 12.4%. None of the cities covered in this release saw real, inflation-adjusted prices fall in 2017. The National Index, which reached its low point in 2012, is up 38 percent in six years after adjusting for inflation, a real annual gain of 5.3 percent. The National Index's average annual real gain from 1976 to 2017 was 1.3 percent. Even considering the recovery from the financial crisis, we are experiencing a boom in home prices.
"Within the last few months, there are beginning to be some signs that gains in housing may be leveling off. Sales of existing homes fell in December and January after seasonal adjustment and are now as low as any month in 2017. Pending sales of existing homes are roughly flat over the last several months. New home sales appear to be following the same trend as existing home sales. While the price increases do not suggest any weakening of demand, mortgage rates rose from 4 percent to 4.4 percent since the start of the year. It is too early to tell if the housing recovery is slowing. If it is, some moderation in price gains could be seen later this year."
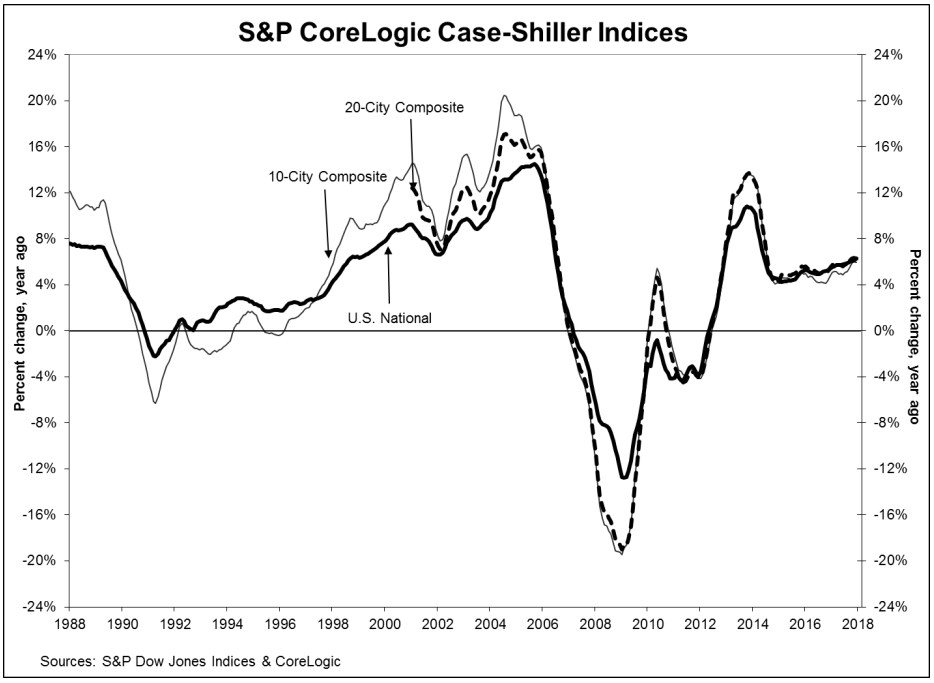
As of December, average home prices for the metros tracked by the composites are back to Winter 2007 levels. The National Index has surpassed its previous pre-crash peak by 6.3 percent while the two composites still lag theirs slightly. The 10-City is 3.5 percent lower and the 20-City is down 1.0 percent.
Black Knight puts the annual gain in its Home Price Index (HPI) at year's end at 6.62 percent, a slight increase from the year-over-year increase in November, 6.44 percent. It was the 68th straight month of annual price appreciation. The national Home Price Index (HPI) was $283,000.
While the annual price changes haven't yet caught up, Black Knight has been reporting steadily decreasing monthly appreciation since a March peak of 1.3 percent. The November to December change was 0.1 percent, the lowest since last January.
New York continued to lead all states in price gains. The month-over-month increase was 1.71 percent, more than twice that of second place Nevada at 0.81 percent. Other strong movers were Georgia (0.69 percent), South Carolina (0.60 percent), and Colorado (0.54 percent.)
Six of the nation's 20 largest states hit new price peaks but prices fell in nine others. In Ohio the HPI was down 1.13 percent and seven of the 10 worst performing metros were in the state. Prices were also down in Michigan, California, and Pennsylvania.
Results were uneven in metro areas as well. Eleven of the 40 largest established new price peaks while prices fell in 20. Among those were Los Angeles, Philadelphia, and Boston.
The Federal Housing Finance Agency is in close agreement with Black Knight regarding the December to December price change, putting it at 6.7 percent, bettering the annual gain in November by 0.2 point. FHFA House Price Index rose 0.3 percent compared to November. The increase from the third quarter was 1.67 percent.
"Home price appreciation in the fourth quarter showed absolutely no letup throughout the U.S.," said Dr. Andrew Leventis, Deputy Chief Economist. "As we begin to evaluate home prices in the first quarter, we will monitor whether new headwinds-higher mortgage rates and changes in tax laws-will lead to any moderation in the rate of house price growth."
Appreciation remained strong nationwide; Mississippi was the only state where prices did not rise between the fourth quarter of 2016 and the same period in 2017 and increases were posted by all 100 of the largest metro areas. The top five areas in annual appreciation were the District of Columbia at 14.3 percent; Washington 12.0 percent; Idaho 11.5 percent; Nevada 11.5 percent; and Utah 10.7 percent.
Of the nine census divisions, the Mountain division experienced the strongest four-quarter appreciation, posting an 8.8 percent gain between the fourth quarters of 2016 and 2017 and a 2.3 percent increase in the fourth quarter of 2017. Annual house price appreciation was weakest in the Middle Atlantic division, where prices rose 5.3 percent between the fourth quarters of 2016 and 2017.
The HPI is calculated using home sales price information from mortgages sold to, or guaranteed by, Fannie Mae and Freddie Mac. Black Knight's HPI utilizes repeat sales data from public records and the company's own loan-level mortgage performance data.
The S&P CoreLogic Case-Shiller indices have a base value of 100 in January 2000; thus, for example, a current index value of 150 translates to a 50 percent appreciation rate since January 2000 for a typical home located within the subject market.
The National Index set another new all-time high in December; 196.23, up from the previous month's peak of 195.94. The 10- and 20-City Composites had readings of 218.41 and 204.45 respectively. Los Angeles claims the highest index reading at 270.16. Cleveland has again claimed last place in its see-saw battle with Detroit. Its reading is 117.24.


