
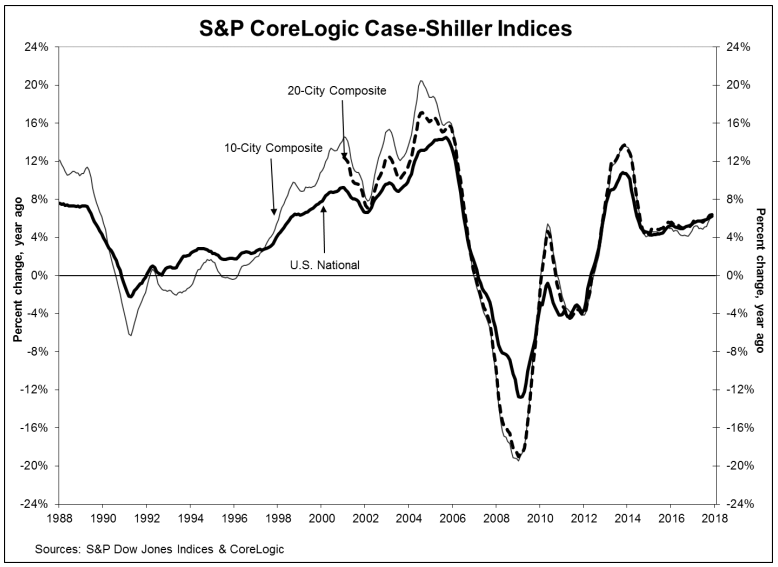
Home price gains picked up the pace again in November according to the S&P CoreLogic Case-Shiller U.S. National Home Price Index. The index, which covers all nine U.S. census divisions, rose 6.2 percent compared to November 2016. The annual increase in October was 6.1 percent. On a monthly basis the index gained 0.2 percent on a non-seasonally adjusted basis and was up 0.7 percent after adjustment.
Case-Shiller's two city-based composite indices also indicated faster appreciation than in the previous report. The 10-City Composite annual increase rose from 5.9 percent in October to 6.1 percent, and the 20-City index was up 6.4 percent compared to 6.3 percent a month earlier. The 10-City and 20-City Composites reported increases of 0.3 percent and 0.2 percent respectively before seasonal adjustment, and 0.8 percent and 0.7 percent gains afterward.
Ten of 20 cities reported increases in November before seasonal adjustment, while all 20 cities posted gains after adjustment. Seattle, Las Vegas, and San Francisco had the highest year-over-year gains among the 20 cities. Seattle led the way with a 12.7 percent year-over-year price increase, followed by Las Vegas, with 10.6 percent appreciation, and San Francisco which was up 9.1 percent. Appreciation was greater in six cities for the year ended in November than their annual increase in October.
David M. Blitzer, Managing Director and Chairman of the Index Committee at S&P Dow Jones Indices, noted that home prices continue to rise three times the rate of inflation. "The S&P CoreLogic Case-Shiller National Index year-over-year increases have been 5 percent or more for 16 months," Blitzer said, while "the 20-City index has climbed at this pace for 28 months. Given slow population and income growth since the financial crisis, demand is not the primary factor in rising home prices. Construction costs, as measured by National Income and Product Accounts, recovered after the financial crisis, increasing between 2 percent and 4 percent annually, but do not explain all of the home price gains. From 2010 to the latest month of data, the construction of single family homes slowed, with single family home starts averaging 632,000 annually. This is less than the annual rate during the 2007-2009 financial crisis of 698,000, which is far less than the long-term average of slightly more than one million annually from 1959 to 2000 and 1.5 million during the 2001-2006 boom years. Without more supply, home prices may continue to substantially outpace inflation."
Blitzer continued, "Looking across the 20 cities covered here, those that enjoyed the fastest price increases before the 2007-2009 financial crisis are again among those cities experiencing the largest gains. San Diego, Los Angeles, Miami and Las Vegas, price leaders in the boom before the crisis, are again seeing strong price gains. They have been joined by three cities where prices were above average during the financial crisis and continue to rise rapidly - Dallas, Portland Oregon, and Seattle."
As of November, the National Index had exceeded the previous price peak set in July 2006 by 6.1 percent. The Index has experienced a 46.2 percent rise from the trough reached in early 2012. The two city composites have not yet regained their June 2006 record high levels but are back to those in the winter of 2007. The 10-City remains down from its peak by 3.6 percent and the 20-City by 1.1 percent.
The S&P CoreLogic Case-Shiller Home Price Indices are constructed to accurately track the price path of typical single-family home pairs for thousands of individual houses from the available universe of arms-length sales data. The National U.S. Home Price Index tracks the value of single-family housing within the United States. The indices have a base value of 100 in January 2000; thus, for example, a current index value of 150 translates to a 50 percent appreciation rate since January 2000 for a typical home located within the subject market.
The National Index set another new all-time high in November; 195.94, up from last month's peak of 195.63. The 10- and 20-City Composites had readings of 218.21 and 204.21 respectively. Los Angeles claims the highest index reading at 270.16. Detroit's reading is lowest at 117.55


