
Prices maintained their upward trajectory in October, with gains on a national level outstripping those in September. The S&P CoreLogic Case-Shiller U.S. National Home Price Index, which covers all nine U.S. census divisions, rose 6.2 percent on a year-over-year basis in October, up from 6.1 percent in the previous month. For the month, the index increased 2.0 percent on a seasonally adjusted basis and was up 0.7 percent unadjusted.
The 10-City Composite posted an annual gain of 6.0 percent, 0.3 percentage point higher than the September increase. The 20-City Composite rose by 6.4 percent compared to 6.2 percent the previous month. Both composites matched the National Index with seasonally adjusted and non-adjusted monthly increases of 0.2 percent and 0.7 percent respectively
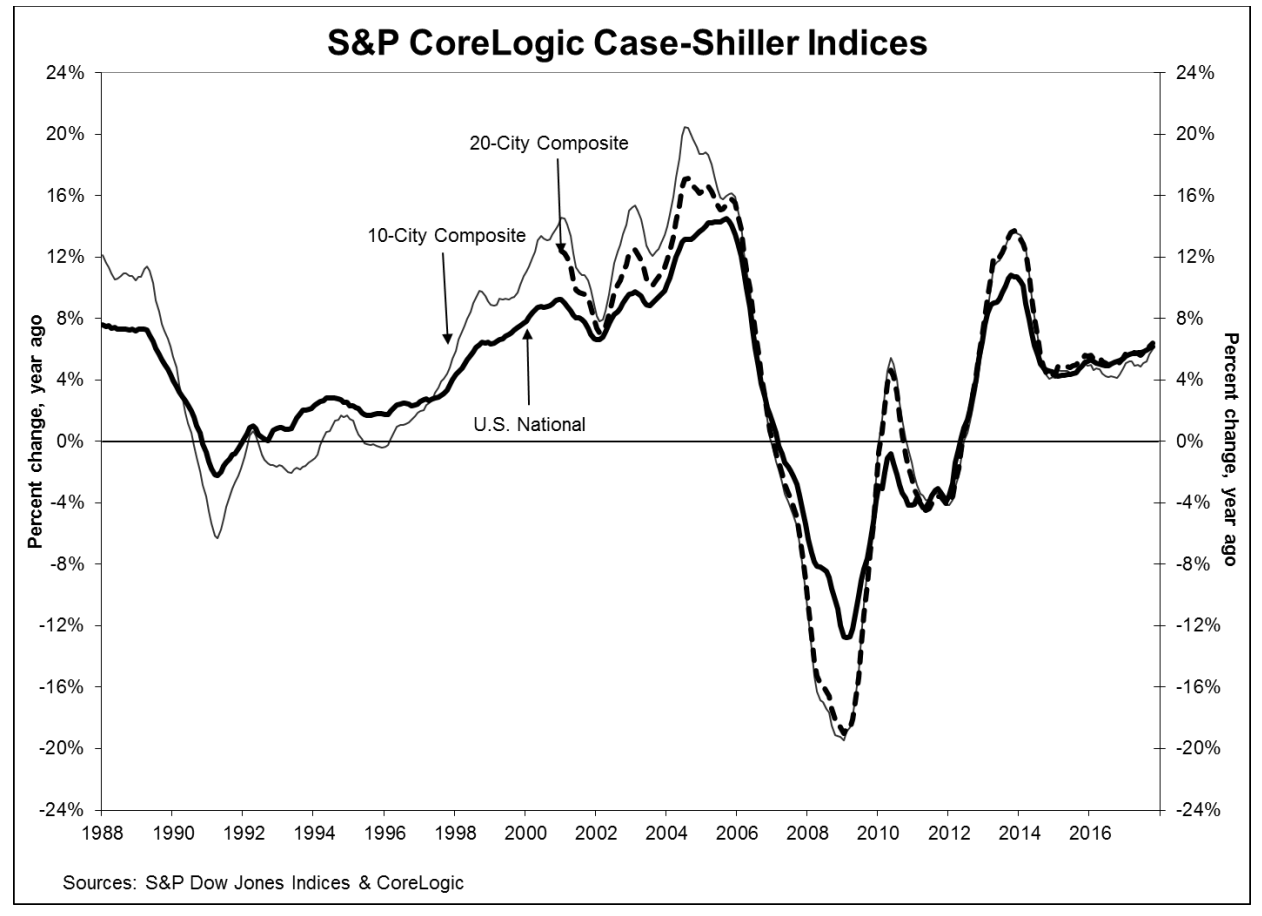
Seattle continues to soar. The city had another annual increase that was nearly double that of the nation as a whole, at 12.7 percent. Las Vegas also saw a gain in the double digits at 10.2 percent. San Diego had the third highest rate of appreciation at 8.1 percent. Eleven of 20 cities reported increases in October before seasonal adjustment, while all 20 cities were higher after seasonal adjustment. Nine of the 20 cities reported greater price increases in the year ending October 2017 than in the 12 months that ended in September.
"Home prices continue their climb supported by low inventories and increasing sales," David M. Blitzer, Managing Director & Chairman of the Index Committee at S&P Dow Jones Indices said. "Nationally, home prices are up 6.2 percent in the 12 months to October, three times the rate of inflation. Sales of existing homes dropped 6.1 percent from March through September; they have since rebounded 8.4 percent in November. Inventories measured by months-supply of homes for sale dropped from the tight level of 4.2 months last summer to only 3.4 months in November.
"Underlying the rising prices for both new and existing homes are low interest rates, low unemployment and continuing economic growth. Some of these favorable factors may shift in 2018. The Fed is widely expected to raise the Fed funds rate three more times to reach 2 percent by the end of the New Year. Since home prices are rising faster than wages, salaries, and inflation, some areas could see potential home buyers compelled to look at renting. Data published by the Urban Institute suggests that in some West coast cities with rapidly rising home prices, renting is more attractive than buying."
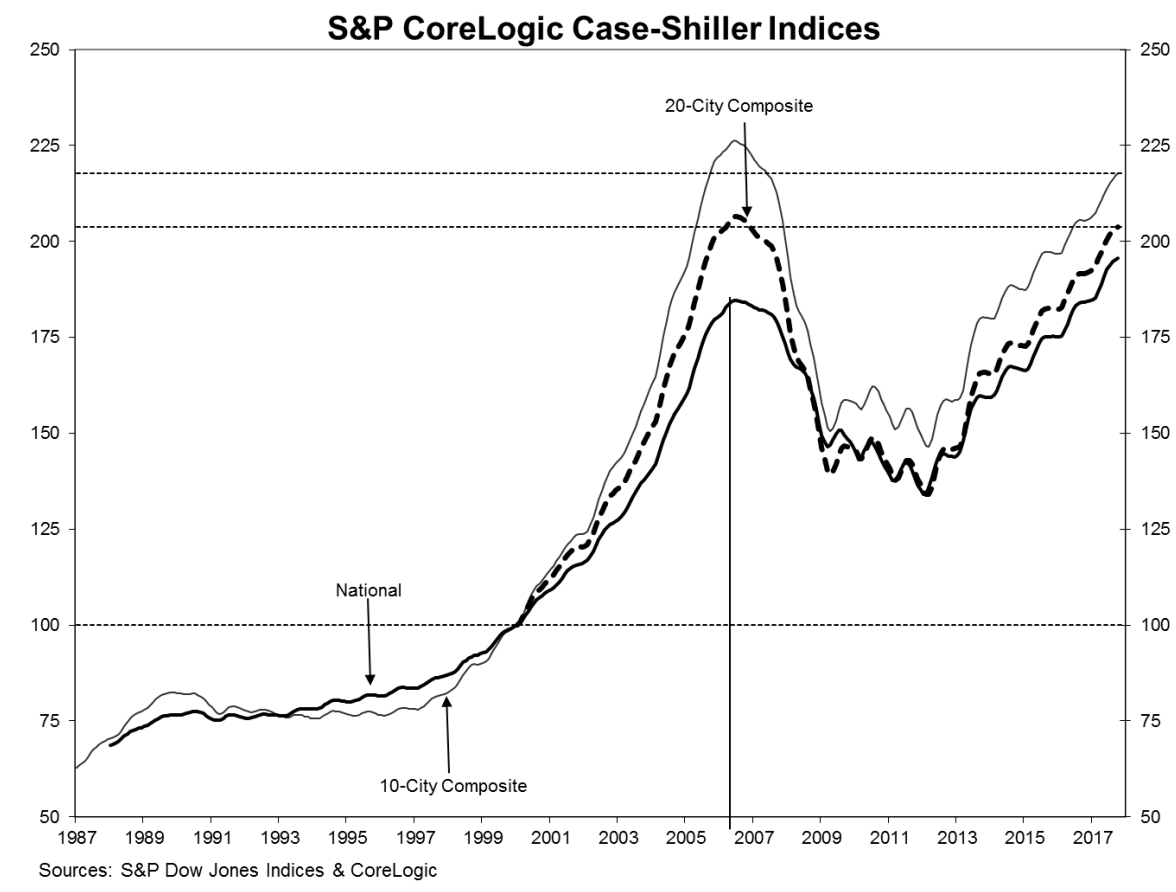
As of October 2017, average home prices for the MSAs within the 10-City and 20-City Composites are back to their winter 2007 levels. The National Index is now 6.0 percent higher than its pre-crisis peak in July 2006 and has risen 46.0 percent from its post-crisis trough in 2012. The two composites have not yet fully recovered from the losses suffered from the housing crisis; the 20-City remains 1.3 percent below its summer 2006 peak and the 10-City is down 3.8 percent.
The S&P CoreLogic Case-Shiller Home Price Indices are constructed to accurately track the price path of typical single-family home pairs for thousands of individual houses from the available universe of arms-length sales data. The National U.S. Home Price Index tracks the value of single-family housing within the United States. The indices have a base value of 100 in January 2000; thus, for example, a current index value of 150 translates to a 50 percent appreciation rate since January 2000 for a typical home located within the subject market.
In what has become a monthly occurrence, the National Index set another new all-time high; 195.63, up from last month's peak of 195.51. The 10- and 20-City Composites had readings of 217.69 and 203.84 respectively. Los Angeles claims the highest index reading at 268.45. Detroit's reading is lowest at 117.85


