
In October, David Blitzer, Managing Director and Chairman of the Index Committee at S&P Dow Jones Indices, said home price increases "appear unstoppable." The latest reports on both the S&P CoreLogic Case-Shiller Home Price Indices and the House Price Index (HPI) from the Federal Housing Finance Agency (FHFA) do nothing too disprove that point.
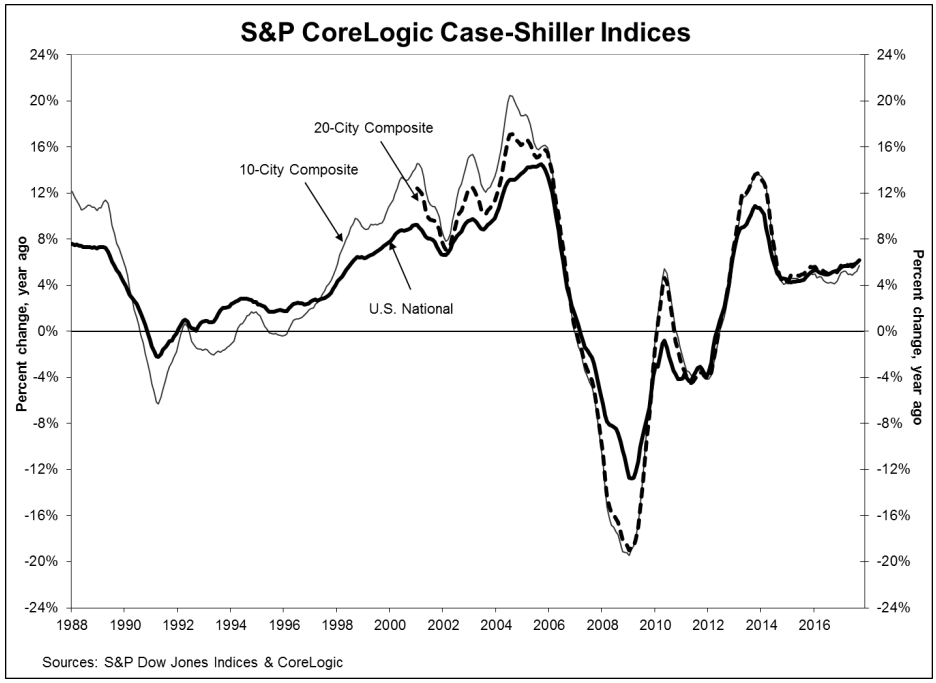
The Case-Shiller National Index, which covers all nine U.S. Census divisions, was up 6.2 percent in September compared to a 5.9 percent annual increase in August. There was little change in the monthly index, with an increase of 0.4 percent before seasonal adjustment and 0.7 percent after, compared to gains of 0.5 and 0.7 percent in August.
The 10-City Composite Index grew 5.7 percent in the 12 months ended in September, up from a 5.2 percent gain posted in August. The 20-City Composite posted a 6.2% year-over-year gain, up from 5.8% the previous month. The 10-City monthly results were 0.5 percent unadjusted and 0.6 percent adjusted; the 20-City was 0.4 percent and 0.5 percent respectively. 15 of the 20 cities reported gains in September before seasonal adjustment, while all 20 cities reported increases afterward.
Seattle appears firmly planted in first place among the 20 cities, reporting a 12.9 percent increase in home prices for the year ended in September. Las Vegas followed with a 9.0 percent, and San Diego was up 8.2 percent. Thirteen cities reported greater price increases in the year ending September 2017 versus the year ending in August.
Blitzer said, "Home prices continued to rise across the country with the S&P CoreLogic Case-Shiller National Index rising at the fastest annual rate since June 2014. Home prices were higher in all 20 cities tracked by these indices compared to a year earlier; 16 cities saw annual price increases accelerate from last month. Strength continues to be concentrated in the west with Seattle, Las Vegas, San Diego and Portland seeing the largest gains. The smallest increases were in Atlanta, New York, Miami, Chicago and Washington. Eight cities have surpassed their pre-financial crisis peaks."
"Most economic indicators suggest that home prices can see further gains. Rental rates and home prices are climbing, the rent-to-buy ratio remains stable, the average rate on a 30-year mortgage is still under 4 percent, and at a 3.8-month supply, the inventory of homes for sale is still low. The overall economy is growing with the unemployment rate at 4.1 percent, inflation at 2 percent and wages rising at 3 percent or more. One dark cloud for housing is affordability - rising prices mean that some people will be squeezed out of the market."
As of September 2017, average home prices for the MSAs within the 10-City and 20-City Composites are back to their winter 2007 levels. The National Index is now 5.9 percent higher than it was at its peak in July 2006, while the 10- and 20-City composites are within 1.5 percent and 4.0 percent of passing their previous peaks. All three indices have risen 45 percent or more from their spring 2012 troughs.
FHFA reports that home prices were up 1.4 percent in the third quarter, which ended on September 30, and gained 6.5 percent on an annual basis. The change from August was 0.3 percent. The FHFA HPI rose 0.7 percent from July to August and 6.7 percent on an annual basis, so the September numbers would indicate some slight slowing in appreciation. However, this index has swung between faster and slower rates of appreciation on nearly a monthly basis all year,
Home prices on the HPI, which is based on home sales price information from mortgages sold to or guaranteed by Fannie Mae and Freddie Mac, rose in all 50 states and the District of Columbia from the third quarter of 2016 to the third quarter this year. The top five increases were posted in the District of Columbia, 11.6 percent; Washington State, 11.5 percent; Hawaii and Arizona, each at 10.0 percent; and Nevada, 9.6 percent. All 100 of the largest metro areas also posted annual gains with the Seattle metro area up front at 14.6 percent.
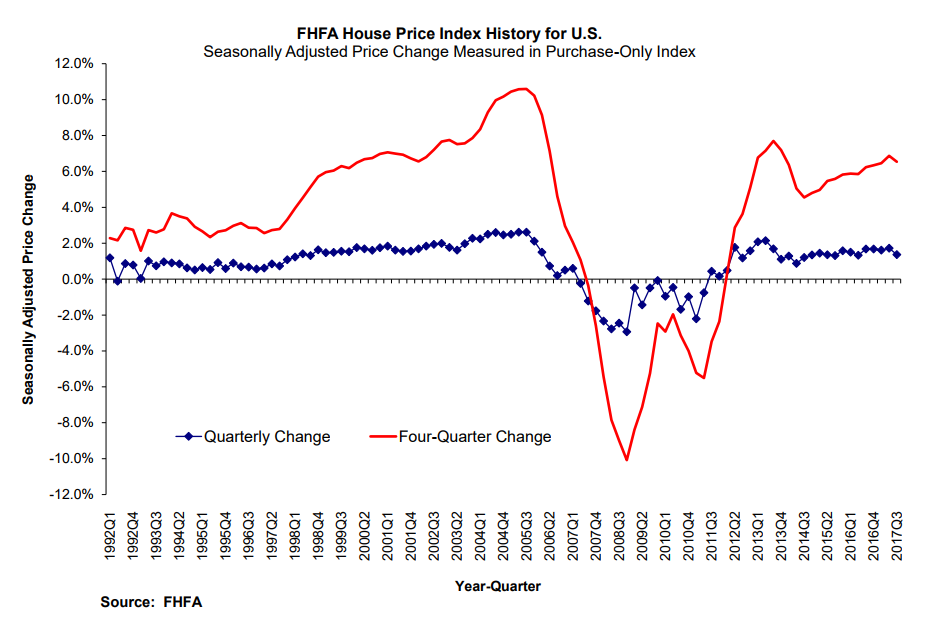
Of the nine census divisions, the Pacific division experienced the strongest annual appreciation, posting an 8.9 percent gain since the third quarter of last year and a 1.7 percent increase since the second quarter of 2017. House price appreciation was weakest in the Middle Atlantic division, where prices rose 4.8 percent annually.
Analysts polled by Econoday had expected the price increases to continue. They were looking for an 0.6 percent increase in the FHFA HPI, stronger than the 0.3 percent reported. The consensus for the Case-Shiller 20-City Composite was an increase of 0.4 percent unadjusted and an annual gain of 6.2 percent, both of which were spot-on.
The S&P CoreLogic Case-Shiller Home Price Indices are constructed to accurately track the price path of typical single-family home pairs for thousands of individual houses from the available universe of arms-length sales data. The National U.S. Home Price Index tracks the value of single-family housing within the United States. The indices have a base value of 100 in January 2000; thus, for example, a current index value of 150 translates to a 50 percent appreciation rate since January 2000 for a typical home located within the subject market.
The National Index has a new all-time high of 195.51, up from last month's peak of 195.05. The 10- and 20-City Composites had readings of 217.27 and 203.50 respectively. Los Angeles claims the highest index reading at 268.05. Detroit reclaimed the low rung on the ladder after losing it to Cleveland for several months. Detroit's reading is 117.65


