
Data from CoreLogic could be sounding a bubble alarm. The company's Home Price Report for September jumped almost a point from the previous month, and the company says nearly half of the largest metropolitan areas are overvalued.
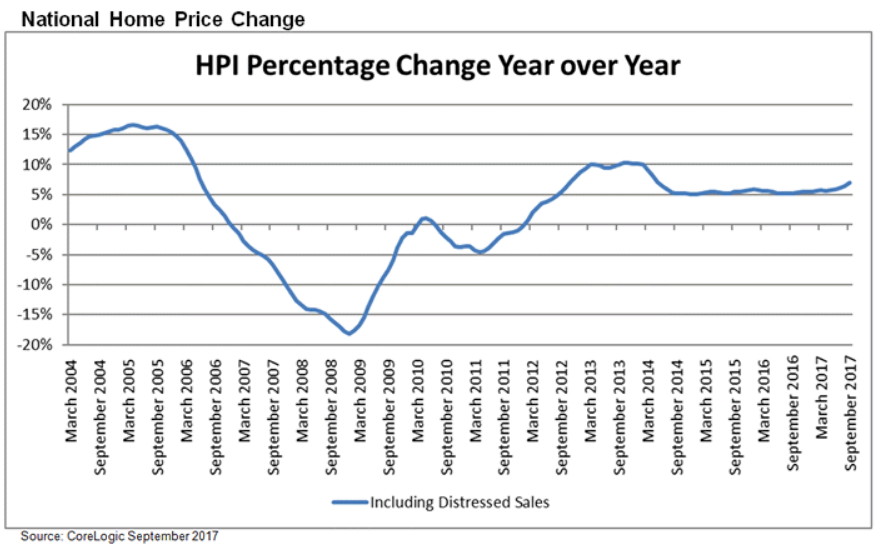
The CoreLogic Home Price Index (HPI) rose 0.9 percent for the third consecutive month in September and the index has averaged 1.1 percent gains over the first nine months of 2017. On a year over year basis, the index was up 7.0 percent tying it with February as the second largest gain so far this year, behind only March with an annual increase of 7.1 percent. The change from August to September was 6.9 percent.
The CoreLogic Market Condition Indicators (MCI) data is an analysis of housing values in the country's 100 largest metropolitan areas based on housing stock. It categorizes home prices in individual markets as undervalued, at value or overvalued by comparing home prices to their long-run, sustainable levels, which are supported by local market fundamentals such as disposable income. The MCI defines an overvalued housing market as one in which home prices are at least 10 percent higher than the long-term, sustainable level, while an undervalued housing market is one in which home prices are at least 10 percent below that level.
In September the MCI classified 36 percent of the top 100 metropolitan areas as overvalued and 48 percent of the largest 50 areas. Among the top 100 metropolitan areas 28 were undervalued and 36 percent were at value. In just the top 50 markets 16 percent were undervalued and 36 percent were at value.
"A strengthening economy, healthy consumer balance sheets and low mortgage interest rates are supporting the continued strong demand for residential real estate," said Frank Martell, president and CEO of CoreLogic. "While demand and home price growth is in a sweet spot, a third of metropolitan markets are overvalued and this will become more of an issue if prices continue to rise next year as we anticipate."
CoreLogic's HPI Forecast is for home prices to increase by 4.7 percent for the 12 months starting in September 2017. On a month-over-month basis home prices are expected to decline by 0.1 percent from September 2017 to October 2017, a net change of a full point from the actual September increase. The CoreLogic HPI Forecast is a projection of home prices using the CoreLogic HPI and other economic variables. Values are derived from state-level forecasts by weighting indices according to the number of owner-occupied households for each state.
"Heading into the fall, home price growth continues to grow at a brisk pace," said Dr. Frank Nothaft, chief economist for CoreLogic. "This appreciation reflects the low for-sale inventory that is holding back sales and pushing up prices. The CoreLogic Single-Family Rent Index rose about 3 percent over the last year, less than half the rise in the national Home Price Index."
Every state but West Virginia, where prices were down 0.3 percent, posted an annual gain. The West continued to lead in appreciation; the five states with the greatest increases were Washington State (12.5 percent), Utah (10.5 percent), Nevada (9.5 percent), Idaho (8.9 percent) and Oregon (8.8 percent.)


