
The Urban Institute (UI) releases a regular report, Housing Finance at a Glance, a "chartbook" loaded with charts and commentary on mortgage activity. The current edition is primarily for the period ending with the first quarter of 2017, although some data is from the second quarter. Much of the chartbook's material, residential construction data, home price indices, negative equity reports, etc., has been covered by MND from original sources, but we have cherry-picked a few items that may have otherwise escaped your and our notice.
Overview of Housing and Mortgage Market Value
The total value of the housing market, as reported by the Federal Reserve's Flow of Funds report has been steadily increasing since 2012, driven by growing household equity. In the first quarter of 2017 total debt and mortgages held stable at $10.3 trillion but household equity reached a new high of $14.4 trillion. This brought the total value of the U.S. housing market to $24.8 trillion, topping the old pre-crisis peak of $23.9 trillion.
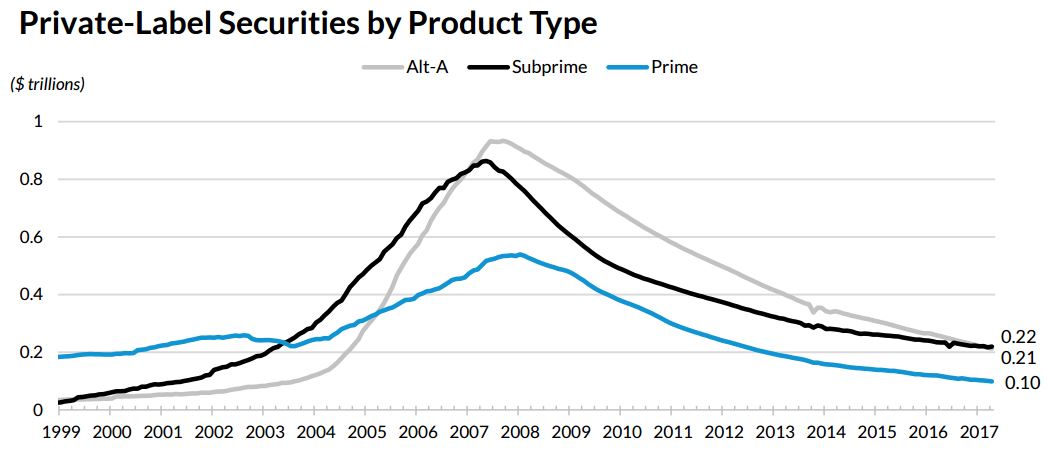
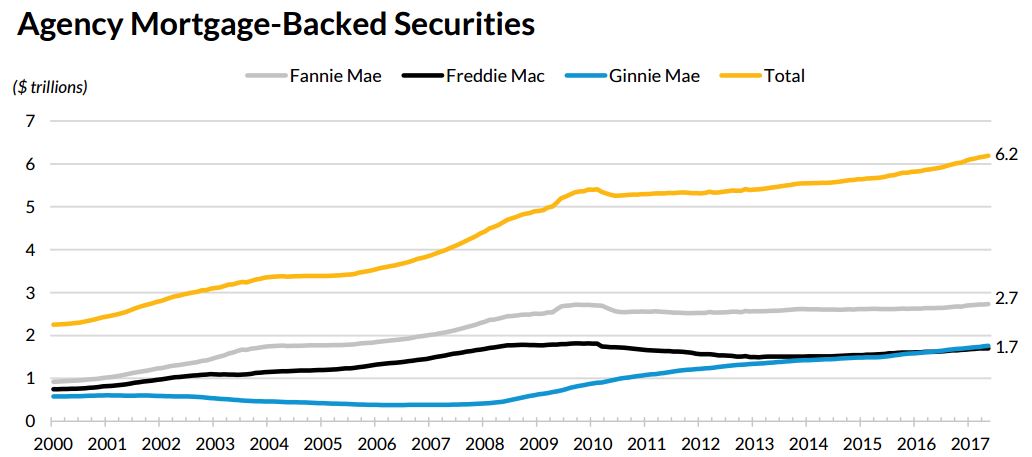
The debt is composed of 6.1 trillion in Agency MBS, 59.5 percent of the total, while unsecuritized first liens held by Freddie Mac, Fannie Mae (the GSEs) and depository institutions make up 29.9 percent or $3.1 trillion. The remaining 1.1 trillion is almost equally distributed between private label securities (PLS) (4.9%) and second liens (5.7%).
The $531 billion in the PLS market was split among prime loans (18.6 percent), Alt-A (40.1 percent) and sub-prime loans while the agency market was dominated by Fannie Mae with a 44.1 percent share. Freddie Mac and Ginnie Mae had 27.4 percent and 28.4 percent respectively. Ginnie Mae has had more outstanding securities than Freddie Mac since May 2016.
Housing Affordability
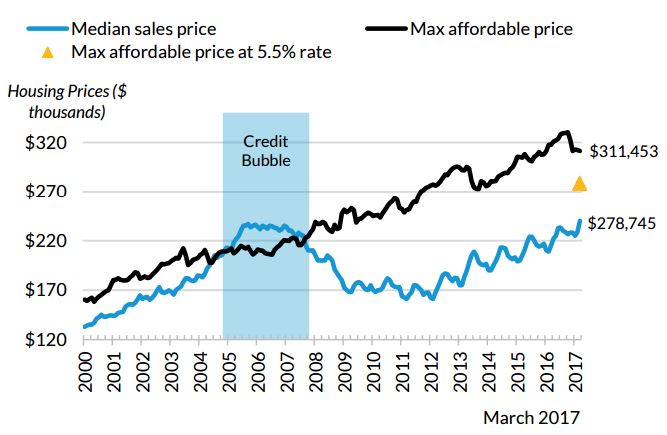
UI calls home prices "still very affordable" by historic standards, even though they have been appreciating strongly for nearly five years, and despite the post-election spike in interest rates. Even if rates were to increase to 5.5 percent, affordability wouldn't exceed the long-term average.
First-Time Homebuyers
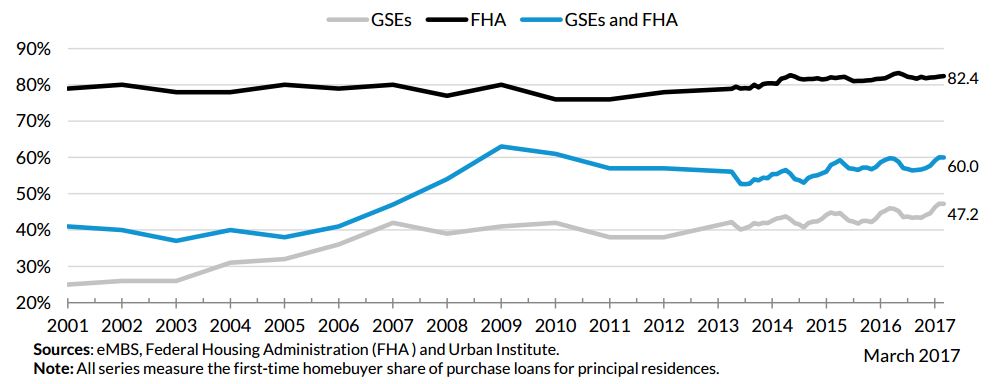
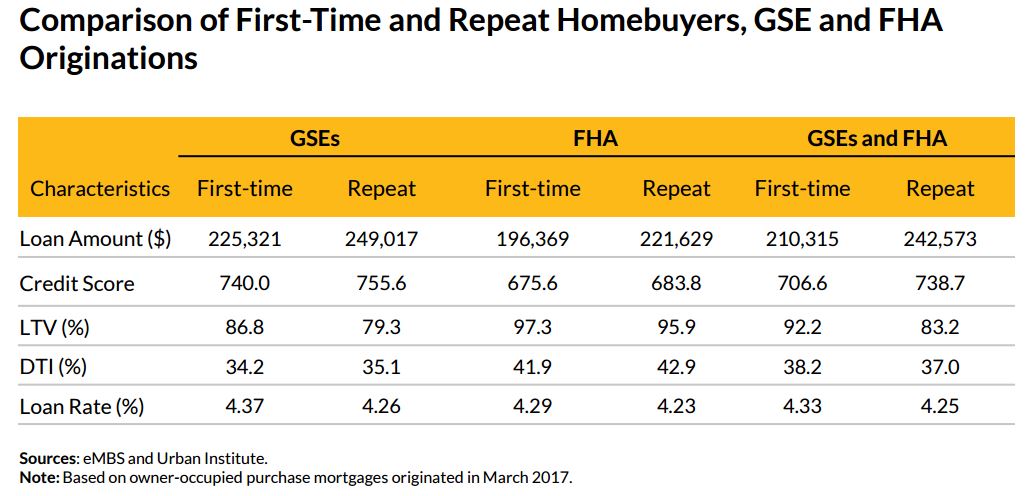
UI has argued for some time that the National Association of Realtor's data on first-time homebuyers, which historically has been around 40 percent but has hovered in the 30-34 percent range since the housing crisis, is too low. The current information they present maintains there was a first-time homebuyer share of 47.2 percent in March. The difference may be that NAR data is based on sales while the Urban Institute is presenting mortgage data. There is still a large share of all-cash transactions, which would make UI's universe substantially smaller. FHA has always had a larger first-time homebuyer share and it was 82.4 percent in March, down from a peak of 83.3 percent the previous May.
Based on March 2017 originations, the average first-time buyer was more likely than a repeat buyer to take out a smaller loan. They also were more likely to have a lower FICO score and higher loan-to-value and debt-to-income ratios and thus a higher interest rate.
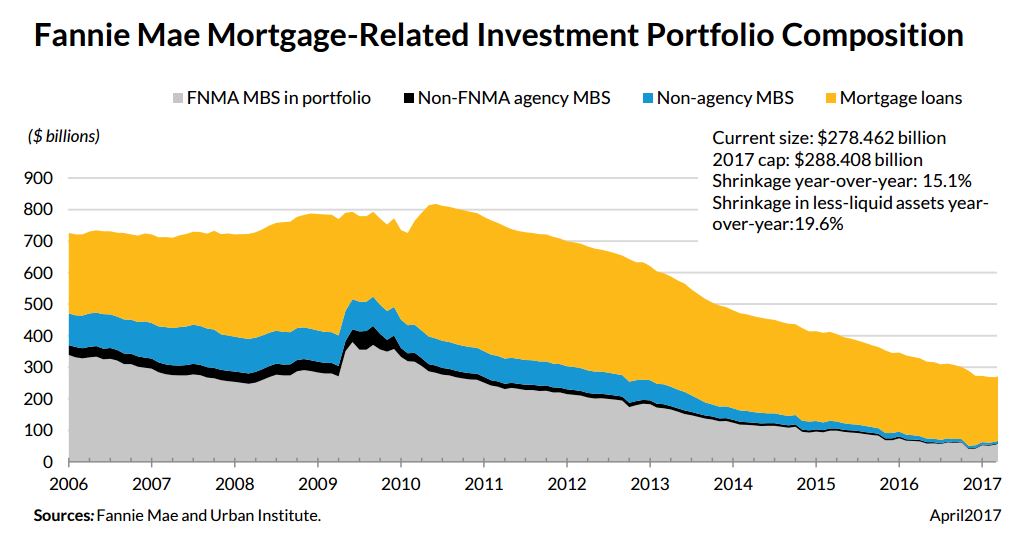
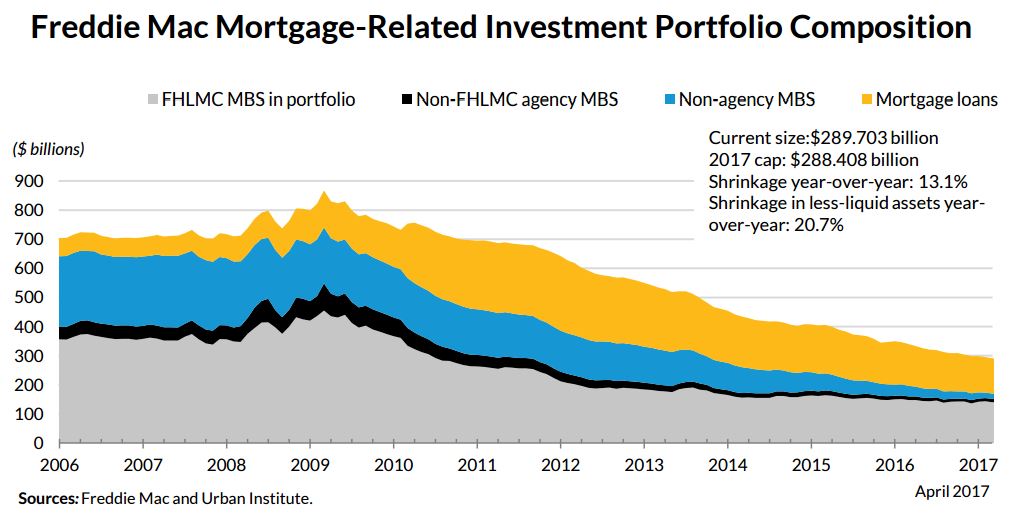
GSE Portfolio Runout
Both Fannie Mae and Freddie Mac continue to shrink their portfolios as mandated by their agreement with the Treasury Department. Over the year ended in April 2017 Fannie Mae contracted its portfolio by 15.1 percent and Freddie Mac by 13.1 percent. Fannie Mae has already reached its required 2017 level and Freddie Mac is only just above it.
Guarantee Fees
The average g-fees on Fannie Mae's new acquisitions increased from 54.2 basis point to 58.7 basis points in the first quarter while Freddie Mac's remained constant at 54 basis points. The increase in these fees since 2011 and 2012 have made a strong contribution to the company's profitability.

Credit Availability
UI notes that the median FICO scores for agency originations have declined substantially since last June, from 742 to 725, a new post-crisis low. UI calls this "intriguing" because it could be an indication that credit availability is improving.
However, further analysis revealed the decrease was driven almost entirely by refinance scores which fell from 752 in October to 725 in April, a decline of 27 points. Purchase FICOs in contrast were down only 4 points, to a median of 725.

As interest rates have risen, the pool of those who could benefit from refinancing, has been shrinking. UI speculates that lenders have been approving more refinances from less credit-worthy borrowers to maintain their volumes. If this is the case, one would expect that, as lenders accept increasing numbers of more marginal borrowers, the scores of those remaining in the pool would go down.
This is indeed the case. The average FICO for borrowers in the refinanceable pool has fallen from 716 in October to 705 this past May. At the same time, that pool has shrunk from 41 percent to 16 percent of homeowners.
So, does this mean credit access is improving? UI says probably not. While the lower accepted FICO score is good news for those who might not have been eligible to refinance before, it is a small universe of borrowers. Further, it doesn't help those who can't get a mortgage to buy a home.


