
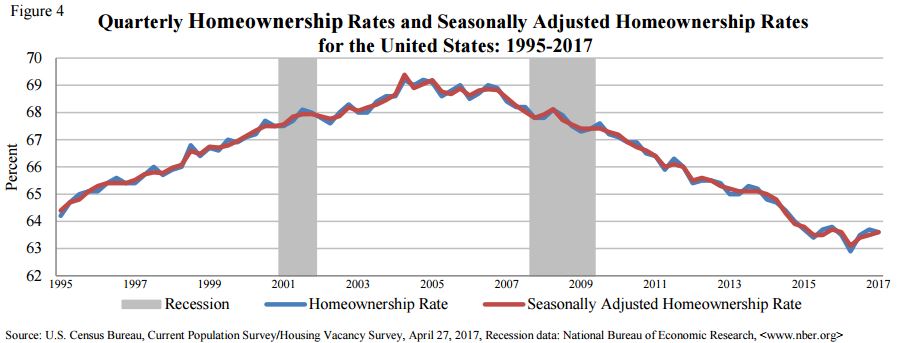
In the second quarter of last year the homeownership rate hit its lowest level in U.S. Census Bureau reports going back 20 years, 62.9 percent. This capped off a slide that began shortly before the financial crisis and after homeownership reached an all-time high of 69.2 percent in two separate quarters of 2004. It stayed close to that level though most of 2006.
After hitting that low last year, homeownership ticked up in each of the next two quarters, reaching 63.7 percent in the fourth quarter of 2016. The Census Bureau released first quarter results for 2017 late last week, and the rate did not continue to rise as hoped, but ticked back down to 63.6 percent. Homeownership was highest in the Midwest at 67.6 percent and lowest in the West at 59.0 percent.
The ten-year decline in homeownership has affected every age group, but most of the attention has been focused on those under age 35. The so-called Millennials lagged other generations forming households, finishing their education at a time of high unemployment. Many moved back or stayed in their parents' homes, returned to school, or shared living quarters with roommates. They were extremely slow to set up households and have also been slower to marry and have children than preceding generations. Over the last few years household formation has increased to nearly normal levels and it was expected that the homeownership rate would follow, especially among those of what is typically considered prime homebuying ages. However, while the rate ticked up by a little more than a point in the third quarter of last year, it has declined over the last two quarters, and is almost back to its all-time low.
The only age group in which homeownership increased from the fourth quarter was those 55 to 65 years of age. Their rate increased from 74.8 percent to 75.6 percent but remains three percentage points below the Q. 1 2011 rate which is the first data point in the current report. The homeownership rate continues to be highest among the oldest age group, those 65 years and older. That rate, 78.6 percent, is down from 81.0 percent in the first quarter of 2011.
The Census Bureau also reported that there were a total of 135.27 million housing units in the U.S. in the first quarter of 2017, 87.3 percent of which were occupied. Just over 55 percent of residential units were owner occupied and 31.8 percent were rentals. There is now a 7.0 percent vacancy rate for rental properties and a 1.7 percent vacancy in owned properties. These are down from 10.6 percent and 2.6 percent respectively in the first quarter of 2010.
The median asking rent for a vacant unit was $864 per month compared to a pre-crisis peak of around $700. The median asking price for a vacant for-sale unit was $176,900 compared to about $200,000 just before the Great Recession.


