
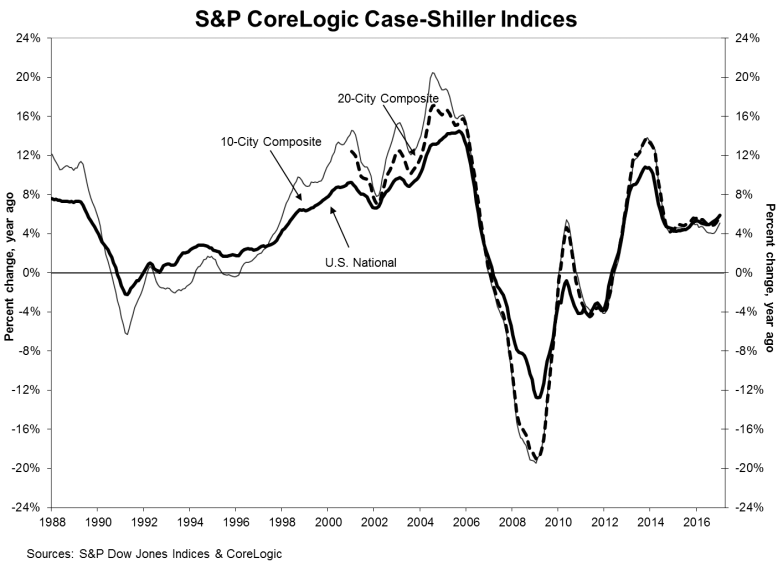
The S&P CoreLogic Case-Shiller U.S. National Home Price Index for January ran counter to other major prices indices in that it continued to show home price gains accelerating into the new year. The Index, which covers the nine U.S. census districts, was up 5.9 percent from January 2016, compared to a year-over-year increase in December of 5.7 percent, revised down from 5.8 percent. The January increase was the largest in 31 months. The three other major indices, from FHFA, CoreLogic, and Black Knight Financial Services had posted annual gains for January that ranged from 0.2 to 0.5 percentage points below the increases in December.
Before seasonal adjustment the National Index posted a month-over-month gain of 0.2 percent in January, and on a seasonally adjusted basis the index rose 0.6 percent, slightly below its 0.7 percent increase the previous month.
The 10 City Composite rose 5.1 percent year-over-year compared to a 4.8 percent increase in December. The 20-City Composite reported annual appreciation of 5.7 percent, 0.2 percentage points more than its December gain.
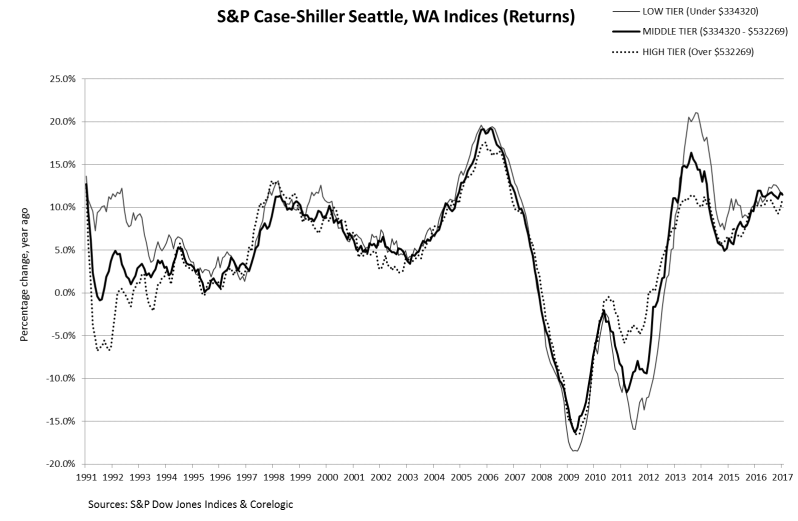
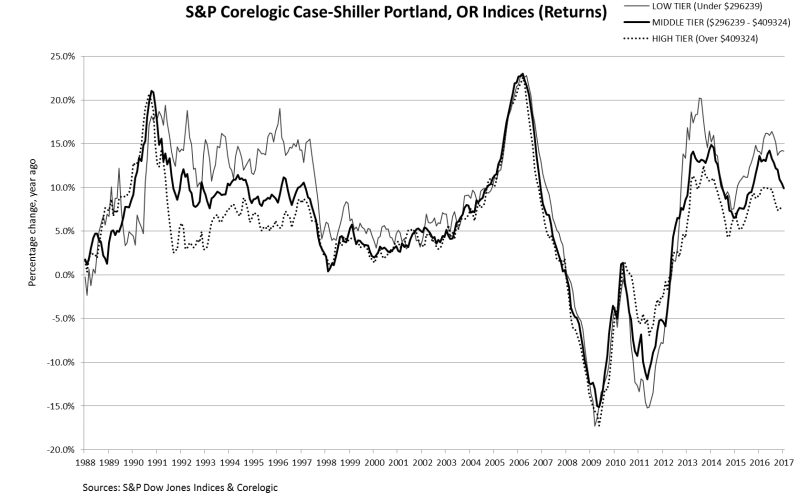
Seattle, Portland, and Denver continue to lead the nation in appreciation. The increase for Seattle was 11.3 percent, followed by Portland with 9.7%, and Denver with a 9.2% increase. Twelve cities reported greater price gains in the 12-month period ending January 2017 versus the period ending December 2016.
The charts below compare the price trends over different home price tiers for Seattle and Portland since 2011. They show housing prices in the high tier to be the most stable, while housing prices in the low tier are the most volatile.
The non-seasonally adjusted 10-City Composite posted a 0.3 percent increase from December and the 20-City Composite was up 0.2 percent in January. After seasonal adjustment both Composites increased by 0.9 percent. Thirteen of 20 cities reported higher prices before seasonal adjustments in January and 19 afterward.
Econoday queries analysts on the 20-City Composite results. They expected seasonally adjusted results in the range of 0.6 to 1.0 percent for the monthly increase and 5.6 to 5.7 for the annual gain. The respective consensuses were 0.8 and 5.7 percent.
David M. Blitzer, Managing Director and Chairman of the Index Committee at S&P Dow Jones Indices, provided the following analysis. "Housing and home prices continue on a generally positive upward trend. The recent action by the Federal Reserve raising the target for the Fed funds rate by a quarter percentage point is expected to add less than a quarter percentage point to mortgage rates in the near future. Given the market's current strength and the economy, the small increase in interest rates isn't expected to dampen home buying. If we see three or four additional increases this year, rising mortgage rates could become concern.
"While prices vary month-to-month and across the country, the national price trend has been positive since the first quarter of 2012. In February, the inventory of homes in the market represented 3.7 months of sales, lower than the long-term average of six months. Tight supplies and rising prices may be deterring some people from trading up to a larger house, further aggravating supplies because fewer people are selling their homes. The prices also hurt affordability as higher prices and mortgage rates shrink the number of households that can afford to buy at current price levels. At some point, this process will force prices to level off and decline - however we don't appear to be there yet."
As of January 2017, average home prices for the MSAs within the 10-City and 20-City Composites were back to their winter 2007 levels. The National Index is now 0.5 percent higher than at its peak in July 2006 while the 10-City is 8.6 percent below its peak and the 20-City is off by 6.6 percent.
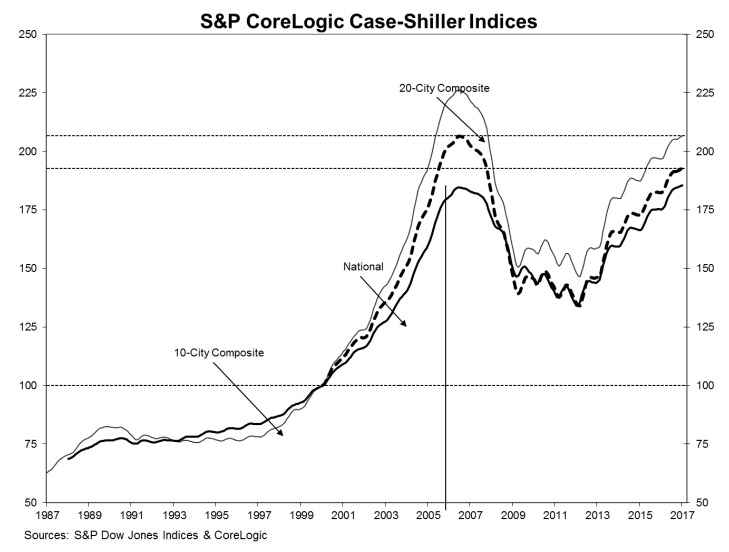
The S&P CoreLogic Case-Shiller Home Price Indices are constructed to accurately track the price path of typical single-family home pairs for thousands of individual houses from the available universe of arms-length sales data. The National U.S. Home Price Index tracks the value of single-family housing within the United States. The indices have a base value of 100 in January 2000; thus, for example, a current index value of 150 translates to a 50 percent appreciation rate since January 2000 for a typical home located within the subject market.
The National Index in January was at 185.5 and the 10- and 20-City Composites had readings of 206.73 and 192.81 respectively. Los Angeles has the highest index reading at 254.08 and Detroit the lowest at 109.54, representing a second straight monthly decline.


