
As anniversaries go, it's not much of one to celebrate, but this year the foreclosure crisis marks its tenth year. Since Mid-2007, more than 7.8 million homes have been foreclosed according to a new retrospective, published by CoreLogic, on the ten-year rise and fall of the cycle. The company's report, United States Residential Foreclosure Crisis: 10 Years Later, comes at a time when the incidence of foreclosure is finally nearing what is considered a normal level.
The report looks at foreclosures beginning with what it calls the relatively healthy years of the early 2000s through the peak of the crisis to the present time, with an estimated 22,000 homes lost to foreclosure each month. Many economists mark the beginning of the crisis with the collapse of two Bear Stearns subprime mortgage funds in June 2007. Those funds had lost nearly all of their value amid a rapid decline in the market for subprime mortgages. The bankruptcy of investment bank Lehman Brothers in September of the following year deepened the crisis.
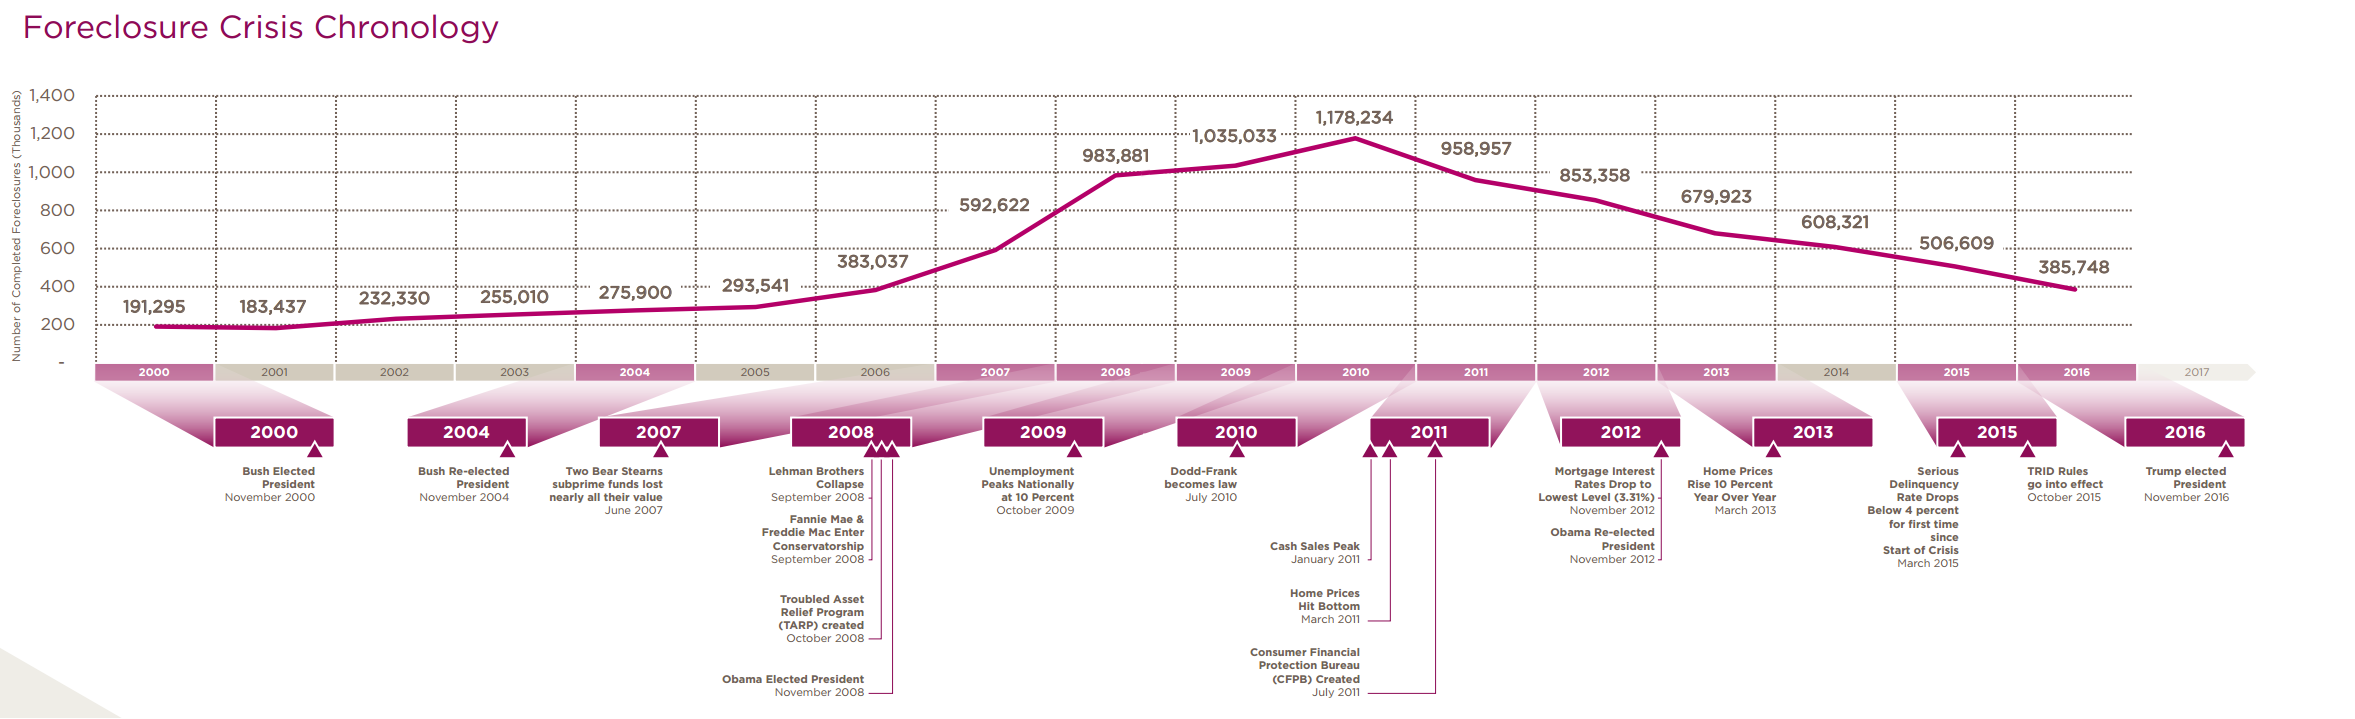
The rising incidence of bank repossessions began as early as 2007 in isolated areas of the county before spreading through most of the nation. There were over 1 million completed foreclosures in 2009.
The peak month for completed foreclosures was September 2010 with approximately 120,000 foreclosures nationwide in that single month. It was at this point that a moratorium on foreclosure sales was initiated by most of the large mortgage services in reaction to wide reports of so-called robo-signing of foreclosure documents and other irregularities in the legal process. Despite the moratorium, the year closed with a total of 1.2 million foreclosures. Since that 2010 peak, the number of completed foreclosures has steadily declined, dropping by nearly 100,000 each year through 2016.
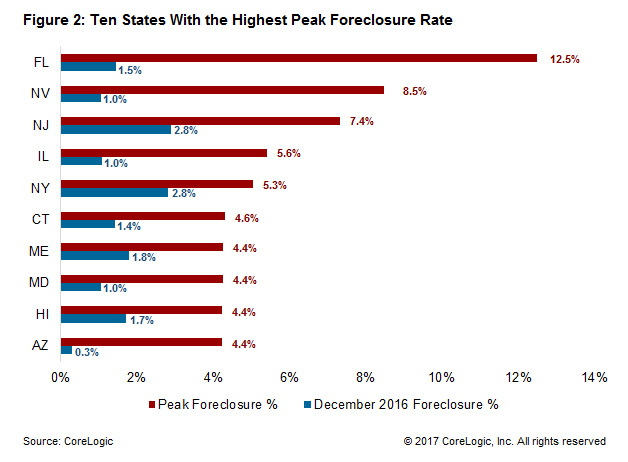
At the peak, the national foreclosure rate was 3.6 percent. That has now receded to 0.9 percent, just slightly above the 2000 to 2006 pre-housing-crisis average foreclosure rate of 0.6 percent. The national peak was dwarfed by that of many individual states. Figure 2 shows the peak and the most current (December 2016) foreclosure rate for the ten states that had suffered the highest peak rates. Florida was number one, topping out at 12.5 percent in June 2011. While the state's most current rate of 1.5 percent was well above the national average, its 11-percentage-point, peak-to-current drop in the foreclosure rate also ranked number one. North Dakota had the lowest peak foreclosure rate at 0.9 percent in February 2011.
Down at the metro level, Miami-Miami Beach-Kendall, Fla. recorded the highest peak foreclosure rate at 19.2 percent in February 2011. By December 2016, its foreclosure rate had fallen over 17 percentage points to 2.1 percent. The Florida city peak was double that of number two, Las Vegas, at 9.6 percent. The rate there is now 1.2 percent.
CoreLogic has always measured total foreclosures against the 2007 date, thus the 7.5 million number, but has also noted in their reports that homeownership itself peaked in the second quarter of 2004 and since then 8.6 million homes have been lost to foreclosure.
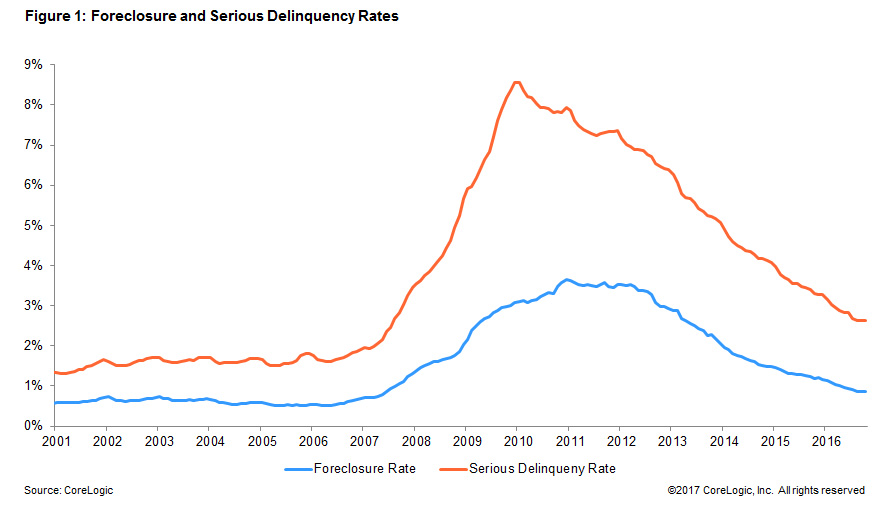
In addition to homes that were actually foreclosed, the crisis has been tracked by most data sources by foreclosure starts, serious delinquency rates, and the foreclosure inventory, which includes all homes in some stage of the legal process of foreclosure. CoreLogic says that there were 336,000 homes in that latter category at the end of 2016, 0.9 percent of all homes with a mortgage. At the peak of the crisis, in September 2010, there were 1.4 million homes in the inventory, a 3.3 percent rate.
The number of mortgages in serious delinquency at the peak was reported by CoreLogic in January 2010 at 3.7 million mortgages or 8.6 percent of all residential mortgage loans. At the end of 2016 that had fallen to 1 million, or 2.6 percent. In recent years, the decline in serious delinquencies has been geographically broad throughout the country with year-over-year decreases from December 2015 to December 2016 in 48 states and the District of Columbia.
Florida was also the leader in serious delinquencies, peaking at 18.8 percent, followed closely by Nevada at 18.5 percent. Florida's most recent serious delinquency rate, at the end of December, was 3.7 percent and Nevada had fallen to 3 percent. The two states with the highest December 2016 serious delinquency rates were New Jersey (5.9 percent) and New York (5.3 percent).
"The country experienced a wild ride in the mortgage market between 2008 and 2012, with the foreclosure peak occurring in 2010," said Dr. Frank Nothaft, chief economist for CoreLogic. "As we look back over 10 years of the foreclosure crisis, we cannot ignore the connection between jobs and homeownership. A healthy economy is driven by jobs coupled with consumer confidence that usually leads to homeownership."


