
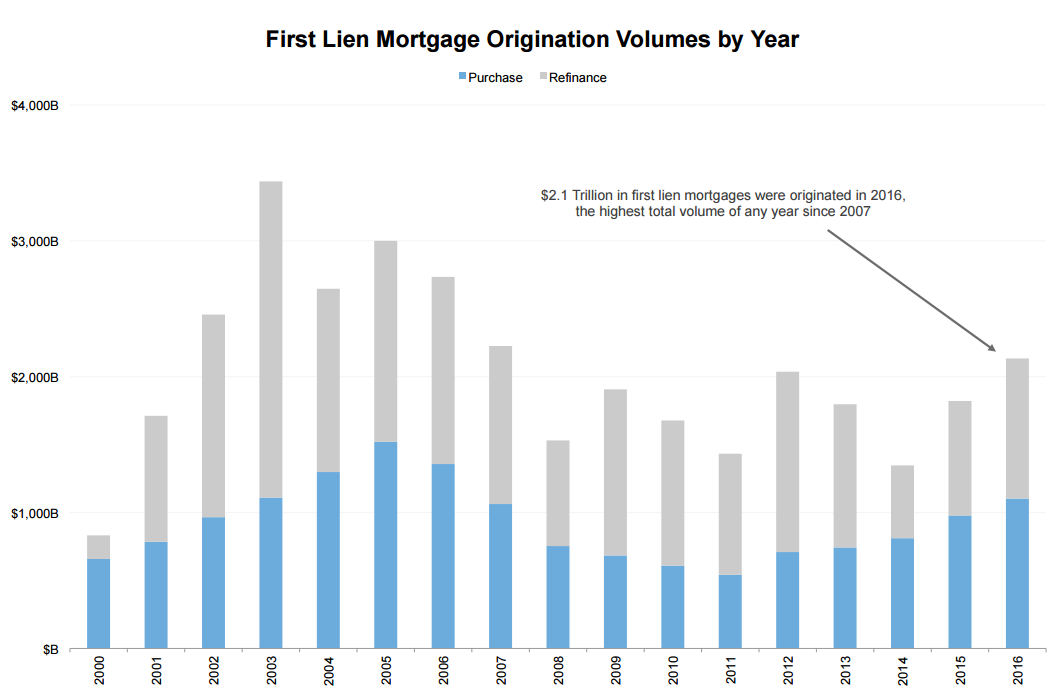
A strong fourth quarter helped push mortgage originations for the whole of 2016 to the highest level in four years. Black Knight's Mortgage Monitor reports that total first lien originations rose 17 percent over originations in 2015 to $2.1 trillion. Refinancing volume was up 22 percent over the 12-month period and purchase mortgage originations increased by 13 percent.
It was the second straight year in which the percentage of purchase originations rose by double digits. The total of $1.1 trillion in purchase mortgages was the highest since 2006, but fell 28 percent short of the peak in such mortgages which was reached by originations in 2005.
Refinancing totaled more than $1 trillion as well, and was the highest annual volume since 2013. In the fourth quarter alone the refinancing totaled $300 billion, a 58 percent increase over refinances in the fourth quarter of 2015. Just under half of all originations during 2016 were refinances.
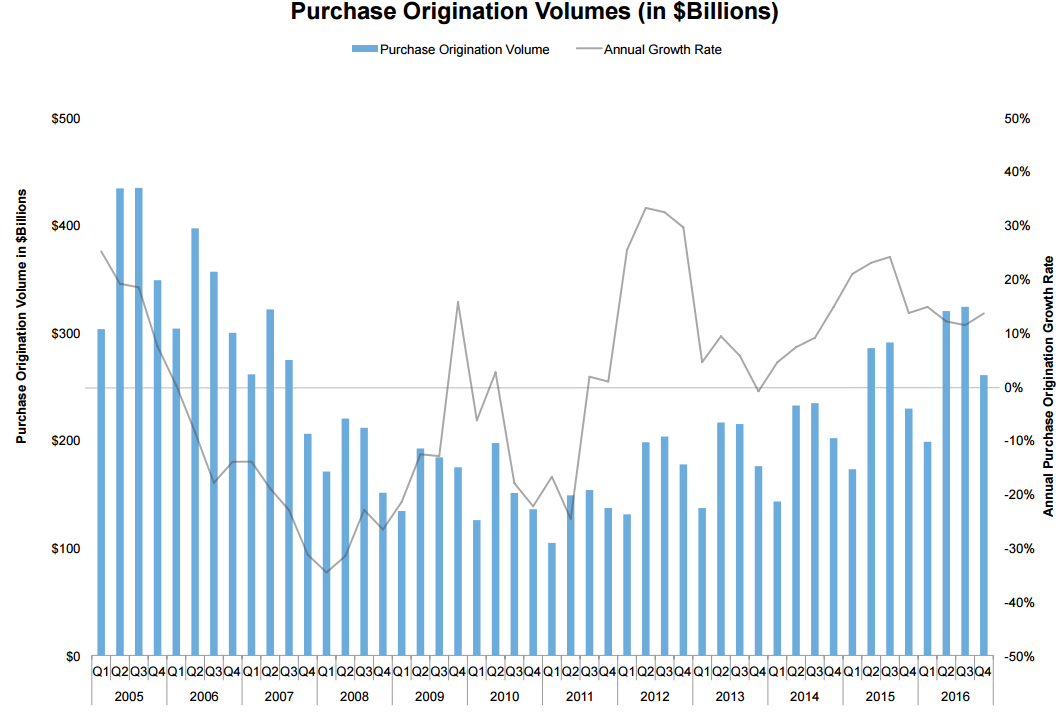
Black Knight Data & Analytics Executive Vice President Ben Graboske said, "A strong fourth quarter finish to the year pushed total 2016 origination volumes to the highest level seen in nine years. We've now seen nine consecutive quarters of double-digit purchase origination growth, and growth overall in the purchase market in 21 of the past 22 quarters."
However, Graboske continues, "As Black Knight reported in our First Look at January's mortgage performance data, prepayment speeds - historically a good indicator of refinance activity - fell by 30 percent from December to January. When you couple this with the fact that there are 5.7 million, or nearly 70 percent, fewer refinance candidates in the market entering Q1 2017 than there were entering Q4 2016, it becomes very likely that we will see these numbers decline significantly in the first quarter."
The fourth quarter was also a strong one for purchase originations. The $260 billion in volume during the quarter was the highest fourth quarter total since 2006 and the annual growth rate, which had been 11 percent at the end of the third quarter, accelerated to 14 percent in the fourth.
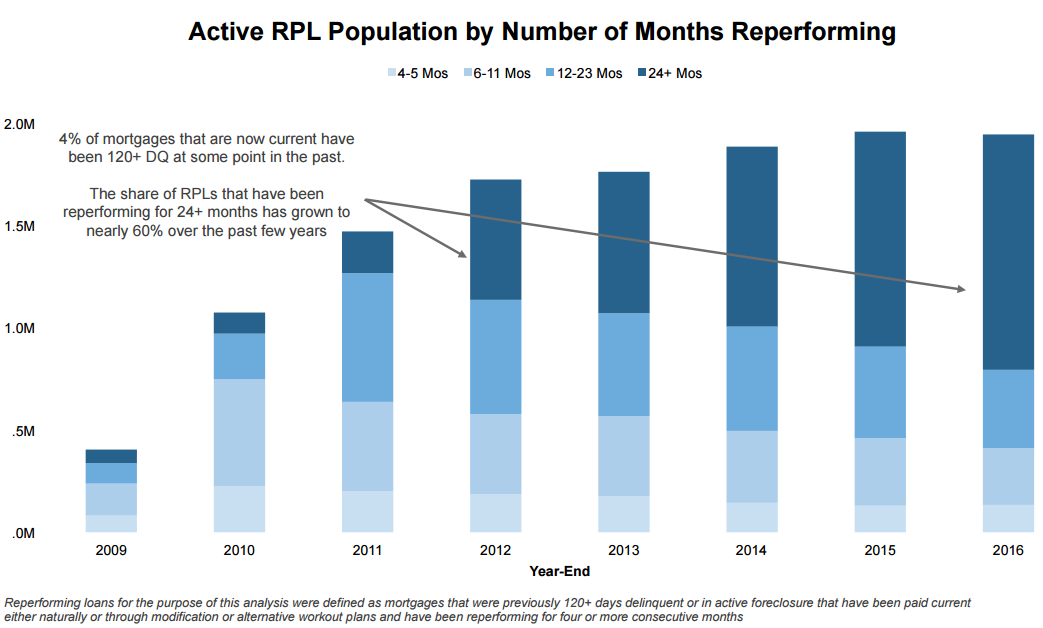
Black Knight also looked at the universe of reperforming loans (RPLs) that have been on track for 24 months or more. RPLs are defined as loans that were, at one point, either more than 120 days past due or in foreclosure before being returned to performing status. Four percent of active loans, a total over almost two million, fall into the category of RPLs. While the total number of these loans decreased 1 percent in 2016, the number of RPLs is up 13 percent over the last four years. The population increased significantly in the wake of the federal government's Home Affordable Modification Program (HAMP). A record number of modifications in 2010 pushed RPLs above the one million mark
As the population has grown, its composition has changed, most notably the time in which the average loan has been reperforming, currently 60 percent. One year ago the 24-month mark had been reached by 54 percent of RPLs and at the end of 2012, 34 percent. In fact, the average RPL today has been reperforming for 35 months, a number which has been trending upward from an average of 12 months at the end of 2010.
Currently nearly half of the RPL population are loans brought back to performing status through proprietary loan modifications; 30 percent were HAMP modifications while other forms of cures represent the remaining 23 percent. Over half of the population are loans originated during the bubble years, 2005 to 2007, and 93 percent are of pre-2010 vintage.

The population of reperforming loans is pretty evenly split among investor categories with 32 percent being GSE loans, 29 percent private label securities (PLS), 25 percent FHA/VA loans and 14 percent portfolio loans. The FHA/VA originations are much more recently originated loans overall than those in the other investor cohorts; 35 percent were originated in 2009 or later compared to 9 percent in the next largest group. The FHA/VA cohort has also been reperforming for nine fewer months than those in the GSE group.
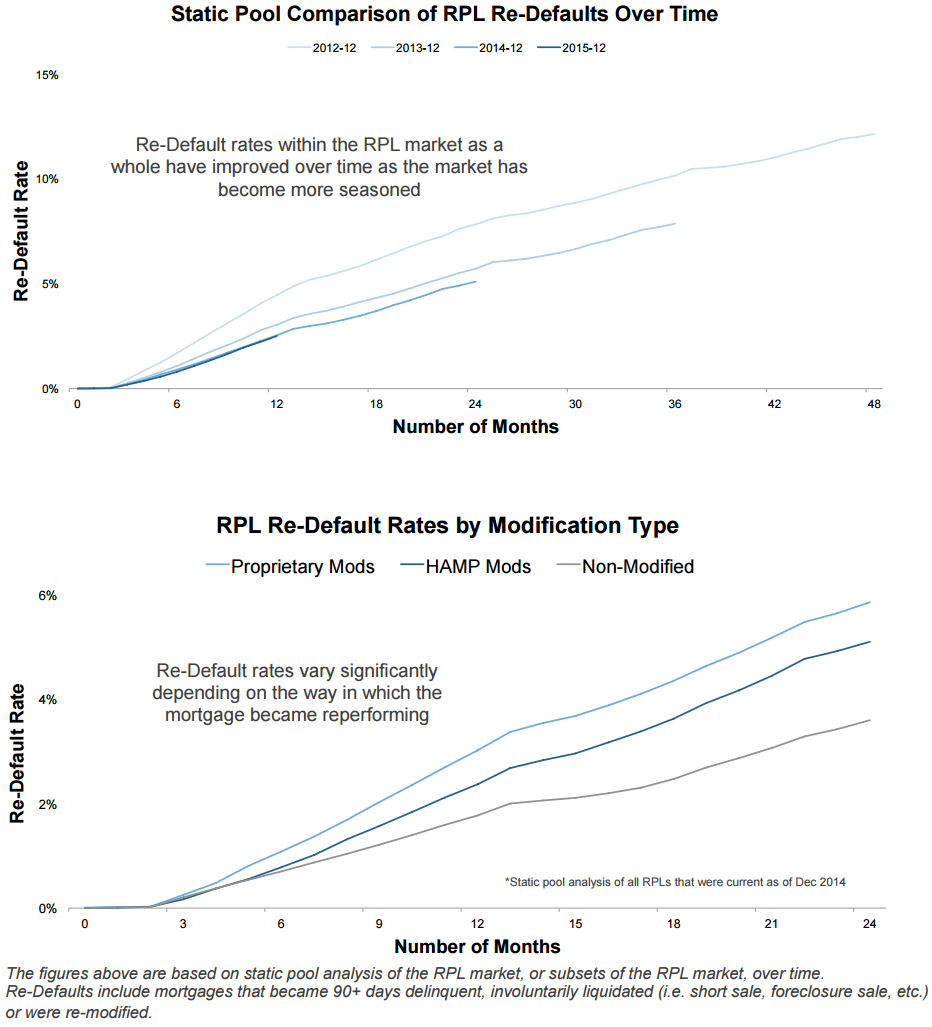
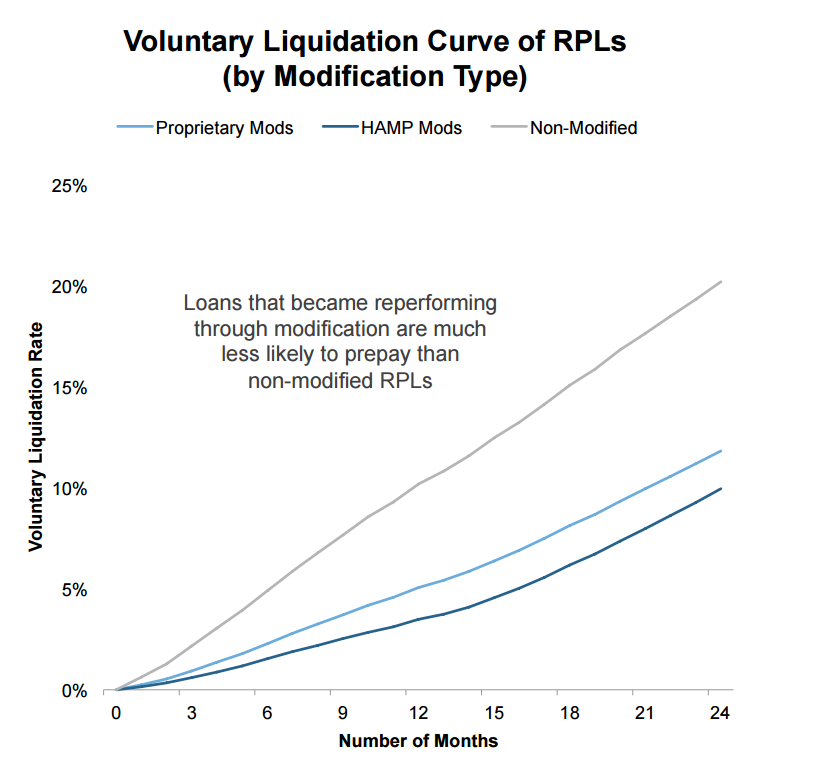
Sixteen percent of the RPL population are loans that have been modified two or more times. One quarter were never modified. Reperformance varies significantly by cure type, date of modification, investor, months reperforming, etc. as well as by typical risk characteristics. Loans brought current through proprietary modifications tend to have higher re-default rates than those brought current through HAMP, while non-modified mortgages tend to outperform modifications in general. Black Knight says that proprietary modifications likely underperform because, as a rule, those borrowers tend to receive less benefit than those with HAMP modifications and their interest rate step ups tend to occur earlier than in HAMP modifications as well.
While performance tends to improve as an RPL becomes more seasoned, there also seems to be a limit to that improvement at around 24 months when the performance stabilizes. Then at the five-year mark and beyond there is some regression. This is the point at which interest rate step-ups begin to impact HAMP modifications. Also, loans with multiple modifications have a much higher re-default rates than those with only one.
RPLs are much less likely to voluntarily prepay than non-RPL loans (50 percent or below in most cases) although the differences decrease over time. This makes sense; RPL borrowers are not only rebuilding credit during this time frame, but also the home value and equity needed to sell or refinance. Those loans that have not been modified also tend to prepay at a much high rate than those RPLs with a modification.
More than a quarter of all RPLs are in California and Florida, only partly due to population density. Both states also have RPL rates higher than the national average. Seven percent of borrowers in Florida have RPLs. These densities are something to keep an eye on as areas where the occur could suffer a spike in default rates in the event of high stress levels. Rhode Island, Mississippi, Nevada and Georgia all have RPL densities over 5 percent.


