
In its current edition of the Mortgage Monitor, covering data from November 2016, Black Knight Financial Services looks at the changing landscape of refinance lending. With the rise in interest rates that started this past fall and accelerated after the election, the population of borrowers which is both likely to qualify for refinancing and has an incentive to do so has fallen to just 2.8 million, a 65 percent drop from October and the lowest level seen since 2008.
When that low water mark was reached eight years ago, refinance originations were 60 percent lower than they are now, but Black Knight points out, that the nation was also in the midst of a recession. The lowest refinancable population post-recession occurred in January 2014 when interest rates climbed to nearly 4.5 percent, leaving only 3.25 million people in a position to refinance. The following month refinance volumes dropped to a level 55 percent lower than they are today.
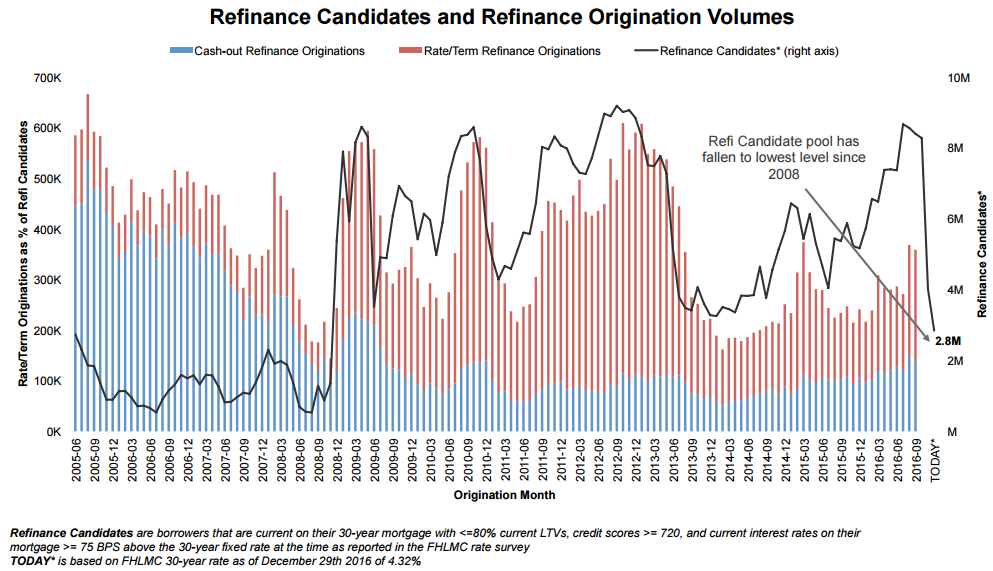
The chart above shows the direct correlation between the number of eligible/motivated refinance candidates and the refinance volume as well as the burnout indicated by the increasing delta between the two in recent years. Black Knight points to interest rate movements and the corresponding rise and fall of candidates and their impact on rate/term origination volumes and their impact on cash-out refinances post crisis as well.
Prior to 2009, even though the number of candidates for relatively small refinancing volumes were still high, refinances were being driven by the cash-out version which accounted for 75 to 80 percent of the total. Cash-out refinances are nowhere near the volume seen before the recession and Black Knight says we should not expect those volumes to return, despite a higher number of candidates now than then, unless lending standards change.
The report continues that the share of borrowers who could benefit from and qualify for a refinance but actually initiated one has been dropping over the last three years. In fact, only 2 percent of those considered refinancable took advantage of the opportunity in July, the lowest pull-through rate in over 10 years.

In addition to showing the burnout in rate/term refinances which began even before the recent rise in interest rates, the chart above shows "pops" in pull-through rates corresponding to decreases in interest rates, both in the volume and the percentage of borrowers taking advantage. While these pops are still occurring today they are not nearly as pronounced as in the past. Black Knight says this could indicate a larger drop in refinance originations than the last time the refinancable population was this low.
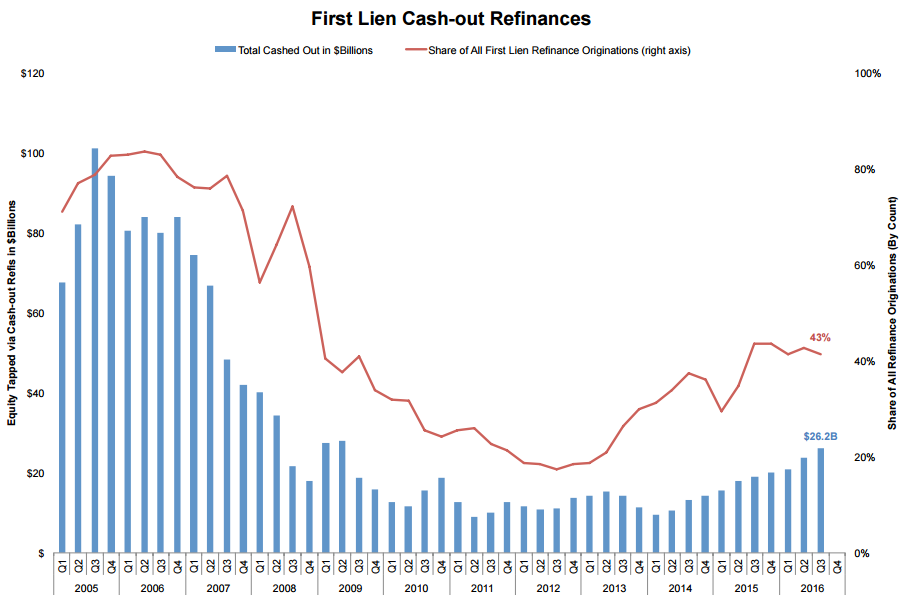
On the other hand, cash-out refinancing is increasing. There were over 400,000 of them in the third quarter of 2016, growing 14 percent from the second quarter and 35 percent from a year earlier. In all, $26.2 billion in equity was extracted during the quarter, the highest since the second quarter of 2009. In the first three quarters of the year just ended a total of $70.8 billion was cashed out, also the highest total since 2009. They type of refinancing has now risen for 10 consecutive quarters.
Less than 2 percent of available equity had been tapped by the end of Nov 2016, 70 percent below the rate and volume of 2005. The resulting post-crash out LTV of 66 percent is near 10-year lows, and the average credit score is above 750, a little higher than in the second quarter of last year.
Black Knight says that cash-out refi's now have a 43 percent share of all activity and this will likely increase as rate/term refinances evaporate in the face of rising interest rates. It is possible that cash-outs will dominate the refinance market this year for the first time since 2008. However, borrowers may also be reluctant to refinance out of their historic low existing rates. When rates went up during the "taper tantrum," cash outs dropped by 40 percent.
Borrowers who refinanced in the third quarter of 2016 reduced their interest rates by an average of 80 basis points (bps), a number that remained fairly consistent through the year to date. However, average monthly savings, at $242 were the third lowest since 2009. Forty percent of rate/term borrowers took a shorter-term mortgage than they had before, the highest percentage on record.
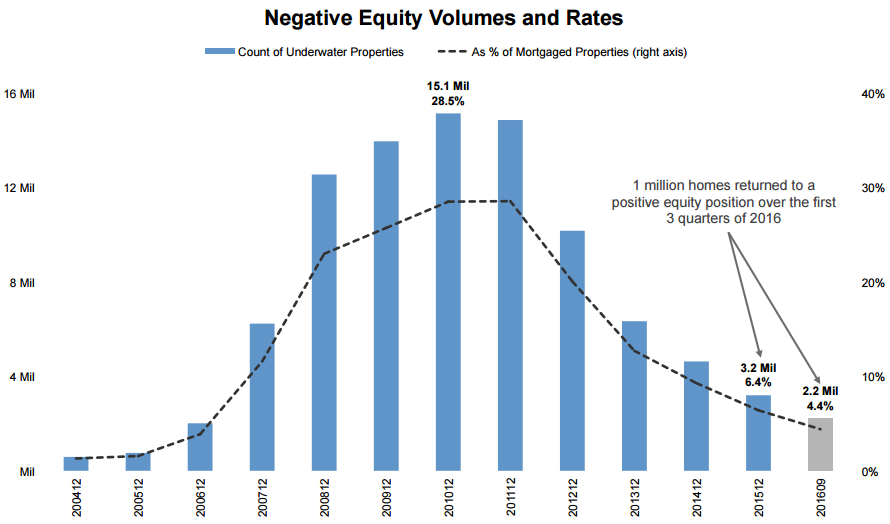
The Monitor also took another look at negative equity, finding that one million homeowners regained positive equity over the first three quarters of the year, bringing the negative equity rate to 4.4 percent. Homes in the bottom 20 percent of price tiers are nine times more likely to be underwater than those in the top 20 percent.
There are now over 39 million borrowers with tappable equity (combined loan-to-value (CLTV) of less than 80 percent) and that equity totals $4.6 trillion nationwide. The average borrower has $118,000 in tappable equity, the highest since 2006. Half of this equity is located in the top 10 metropolitan areas and California alone accounts for nearly 40 percent.
As Black Knight Data & Analytics Executive Vice President Ben Graboske comments, "The negative equity situation has improved substantially since the height of the great recession. There are now just 2.2 million homeowners left in negative equity positions, a full one million fewer than at the start of 2016. Whereas negative home equity was once a widespread national problem - with roughly 30 percent of all homeowners being underwater on their mortgages at the end of 2010 - it has now become much more of a localized issue.
"By and large, the majority of states have negative equity rates below the national average of 4.4 percent. There are, though, some pockets where homeowners continue to struggle. Three states in particular stand out: Nevada, Missouri and New Jersey, all of which have negative equity rates more than twice the national average. Atlantic City leads the nation, with 23 percent of its borrowers underwater, followed by St. Louis at 20 percent. We also see that lower-priced homes - those in the bottom 20 percent of prices in their communities - are nine times more likely to be underwater than those in the top 20 percent."
Black Knight also looked at the impact of the rising interest rate environment on how - and if - borrowers tap into their available equity. The share of tappable equity held by borrowers with a first lien interest rate above the average 30-year fixed rate dropped from 73 percent in October to just 33 percent the end of December. Historically, borrowers with interest rates above par have been both more likely to tap into equity and more likely to refinance their entire first lien to do so (and getting a better first lien interest rate in the process). Likewise, borrowers with interest rates below par have been less likely to tap into equity, and more likely to use a second lien when they do.
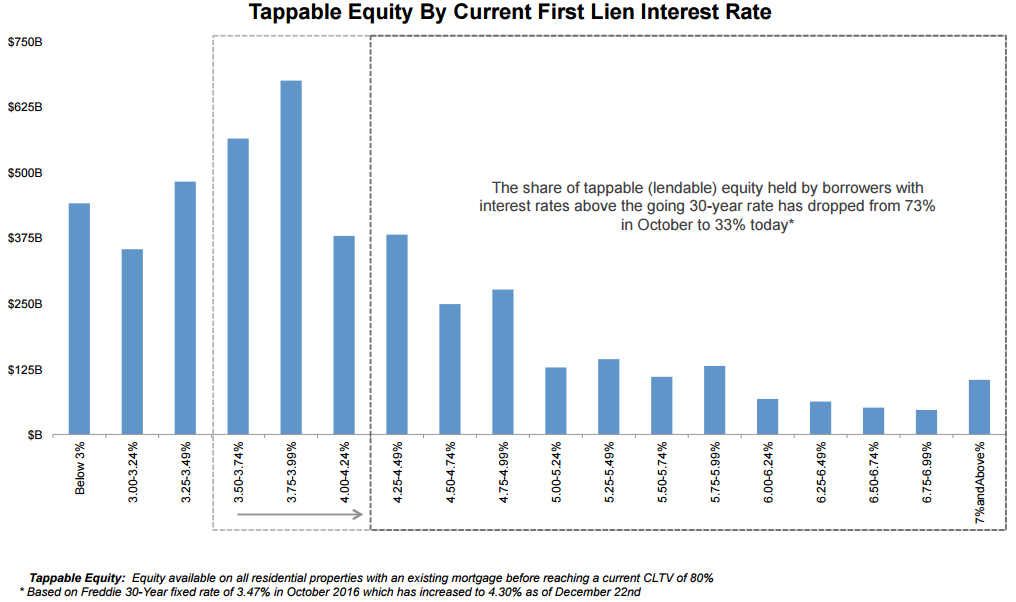
All things considered, Black Knight concludes, home equity line of credit (HELOC) lending may become a more appealing vehicle for tapping equity than a full first lien refinance.


