
It took ten years and change, but national prices as measured by the S&P CoreLogic Case-Shiller National Index have finally surpassed the previous pre-crisis high set in July 2006. The Home Price Index, which covers all nine U.S. census divisions, rose by 5.5 percent year-over-year in September, bringing it 0.1 percent above the earlier peak. The August 2015 to August 2016 gain had been 5.1 percent.
The Case-Shiller number was on the low end of home price estimates for September. Black Knight had put the annual increase at 5.4 percent while the National Association of Realtors reported a 5.6 percent change. Both the CoreLogic HPI and that from the Federal Housing Finance Agency (FHFA) were significantly higher, at 6.3 and 6.1 percent respectively. Of the four, the FHFA index was the only one that didn't indicate an acceleration in annual increases from August to September.
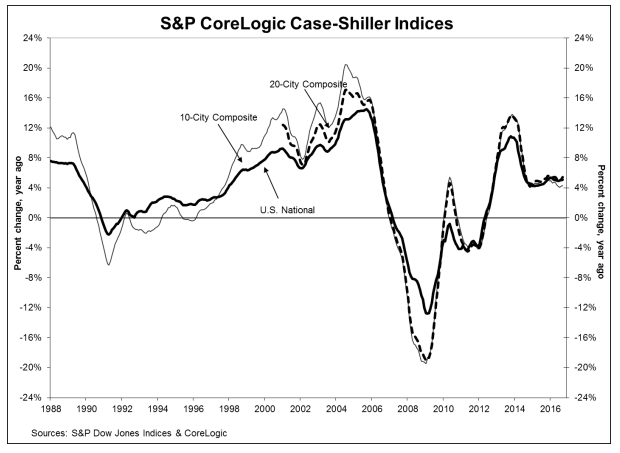
Case-Shiller's 10-City Composite Index was up 4.3 percent from September 2015 to September 2016, compared to a 4.2 percent annual gain in August. The 20-City Composite rose 5.1 percent, the same increase as a month earlier.
Seattle, Portland, and Denver were again the cities in the 20-City Composite with the highest rate of annual appreciation. Seattle was up 11.0 percent, Portland 10.9 percent, and Denver 8.7 percent. Twelve cities had larger annual price gains in September than they had in August.
On a monthly basis, the National Index was up 0.4 percent on a non-seasonally adjusted basis and 0.8 percent when adjusted. Both the 10- and the 20-City Composites were up 0.1 percent unadjusted. After adjustment, the 10-City posted a 0.2 percent gain and the 20-City was up 0.4 percent. Fifteen of the cities reported positive changes on a non-adjusted basis while prices rose in all 20 when adjusted.
"The new peak set by the S&P Case-Shiller CoreLogic National Index will be seen as marking a shift from the housing recovery to the hoped-for start of a new advance" says David M. Blitzer, Managing Director and Chairman of the Index Committee at S&P Dow Jones Indices. "While seven of the 20 cities previously reached new post-recession peaks, those that experienced the biggest booms -- Miami, Tampa, Phoenix and Las Vegas -- remain well below their all-time highs. Other housing indicators are also giving positive signals: sales of existing and new homes are rising and housing starts at an annual rate of 1.3 million units are at a post-recession peak.
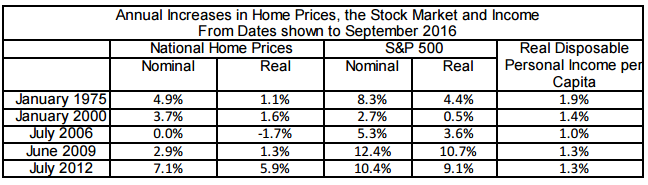
"The table (below) summarizes how housing, incomes and the stock market have moved over the past few decades. From 1975 (the earliest date for the S&P Case-Shiller CoreLogic National Index) to this report, home prices rose at an annual rate of 4.9 percent before adjusting for inflation. The real or inflation adjusted pace was 1.1 percent per year. Real disposable personal income per capita - income after inflation and taxes on a per-person basis -- rose 1.9 percent, outpacing home prices over the entire period. The stock market, measured by the S&P 500 adjusted for inflation, did better at 4.4 percent per year. As seen in the table, the time frame makes a big difference. We are currently experiencing the best real estate returns since the bottom in July of 2012 when prices rose at a 5.9 percent real annual rate. Given history, this trend is unlikely to be sustained."
While the National Index has broken through to a new high, the two city composites are still lagging their own July 2006 peaks. The 20-City remains off by 7.1 percent and the 10 City is down 9.1 percent. The 10-City has risen out of its March 2012 trough by 40.5 percent and the 20-City has regained 43.0 percent. These recoveries have brought both indices back to winter 2007 levels.
The S&P CoreLogic Case-Shiller Home Price Indices are constructed to accurately track the price path of typical single-family home pairs for thousands of individual houses from the available universe of arms-length sales data. The National U.S. Home Price Index tracks the value of single-family housing within the United States. The indices have a base value of 100 in January 2000; thus, for example, a current index value of 150 translates to a 50 percent appreciation rate since January 2000 for a typical home located within the subject market.
The National Index in September was at 184.0 and the 10- and 20-City Composites had readings of 205.77 and 191.78 respectively. Los Angeles has the highest index reading at 252.65 and Detroit the lowest at 109.54.


