
In its "first look" at August mortgage performance data Black Knight noted that the Single Month Mortality (SMM) or prepayment rate for the month had skyrocketed, rising by 32 percent from July to a rate of 1.67 percent of all outstanding mortgages. The company said this was in part fueled by post-Brexit interest rates and was the highest SMM rate in more than three years.
Prepayment rates are generally considered a good indicator of refinance activity, but that isn't the only factor behind it. The company's Mortgage Monitor goes deeper into the subject, providing a breakdown of prepay activity by the driving factor behind it. The company used its mortgage performance database as well as public records to conduct its analysis.
On average, over the last 10 years about 58 percent of SMM can be accounted for by refinancing while housing turnover drives about 22 percent, curtailments or partial prepays 5 percent and defaults 10 percent, a number expected to drop in the future.
The company found that prepays due to housing turnover are seasonal, vary by loan characteristics, and to some degree by loan characteristics as well. Curtailments also vary seasonally but borrower characteristics have an impact as those with higher credit scores are more likely to pay down their loans prematurely. Interest rates which are a major driver of refinances also play a role. For example, in mid-2014 as rates were rising refinancing accounted for only 37 percent of SSM while housing turnover grabbed the lead at 40 percent.
Market segments also impact SSM. Looking at loans by credit scores, Black Knight found that prepayments, and specifically those driven by refinancing, were much higher in the housing boom years (2005-2006) in the lower credit segments of the market. Even those borrowers' rate of housing turnover was higher than that of higher credit score borrowers.
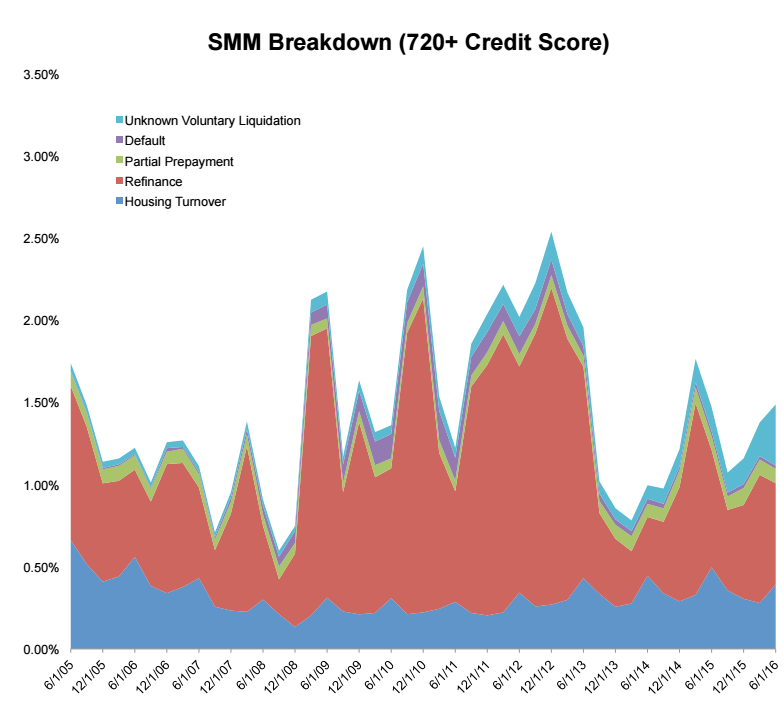
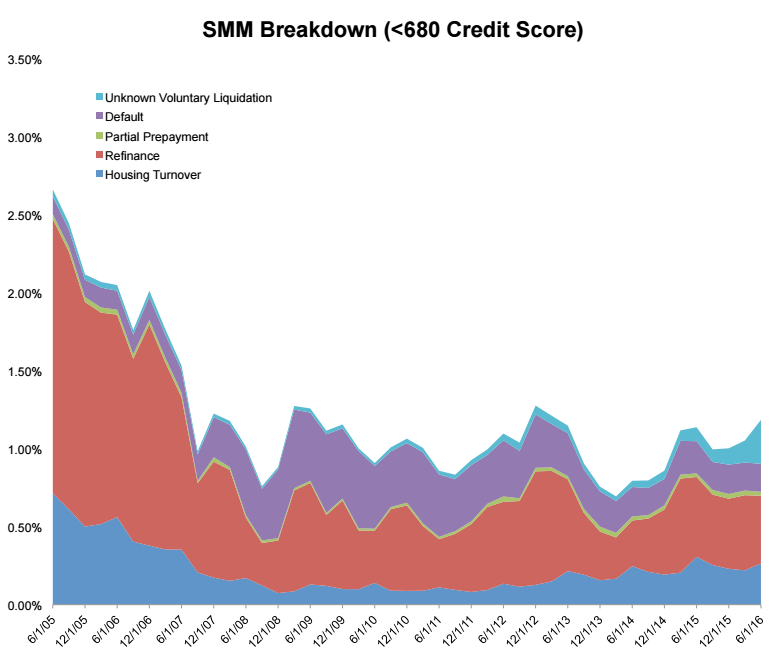
When the refinance boom arrived (2009-2012) 70 percent of prepayment activity in the higher credit score population (above 720) was for refinancing as compared to less than half of that in the segment with scores below 680. In the case of lower score prepays, almost 40 percent was driven by defaults.
As home sales have picked up so has the share of housing turnover within SMM and it is now driving the highest level of prepayment activity since 2006. However, it is still lower than in 2005 and still varies widely by credit score. SMM due to housing turnover remains 75 percent below the peak levels in the lower score groups but within 25 percent of peak in the over 720 credit group.
Black Knight explains this variance by both a lack of credit availability for those with lower credit scores as well as because those homeowners were more likely to have purchased their homes in the bubble era and less likely to have the equity necessary to move.
As to curtailments, the seasonality of that activity may be related to bonuses and tax returns. Delinquencies tend to drop from December to March as that sporadic income arrives and borrowers catch up on payments. Black Knight speculates they may be using those excess funds to pay down principal on their mortgages as well.
Borrowers with higher credit scores are more likely to pay down principal proactively and the current activity is the highest on record. In December 2015 .08 percent of principal on mortgages was paid off via curtailment, the largest one-month volume on record dating back to 2005. Proactive prepayments have been rising since late 2009 and now account for over 7 percent of unscheduled principal payments compared to a historic rate of 4 percent.
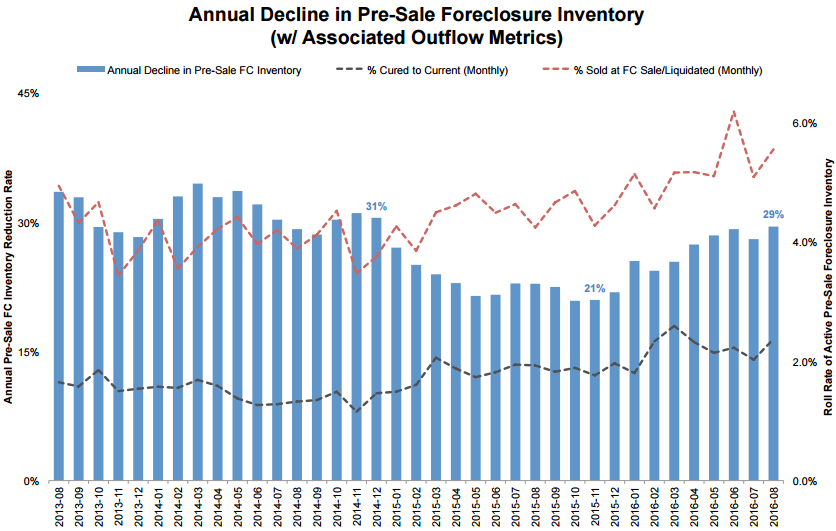
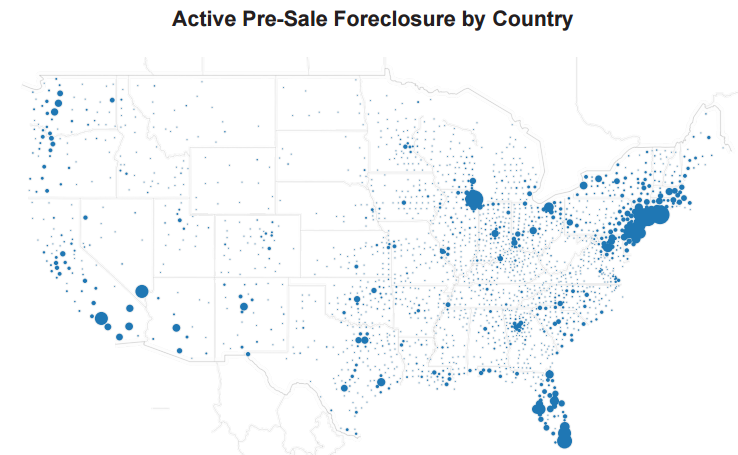
The Monitor took a similar forensic type look at foreclosure inventories. While the number of loans in active foreclosure is declining at the fastest rate since 2014, down 29 percent in August on a year-over-year basis, and that rate has been accelerating throughout this year, national active foreclosure inventories remain at two times their pre-crisis levels There were multiple causes for the decline and the company also found that the distressed property situation is becoming increasingly localized.
The first cause of shrinking inventories is the slower referral volume. March and July of this year had the first and second lowest volumes of foreclosure starts in 10 years. The second cause is a pick-up in foreclosure completions and the third cause is an increase in the share of loans that are curing, that is moving from foreclosure to being paid off or brought current.
While distress is evident in all parts of the country, there has been a definite shift from Florida where only two counties, Miami Dade and Hillsborough remain among the top 10 in foreclosure inventory, to New York which accounts for four and New Jersey with one county in the top ten and six more in the top 20. Together those two states account for more than 25 percent of all inventory in the country.
Further exacerbating the problem, New York has the lowest foreclosure completion rate in the country, 17 percent compared to a national rate of 23 percent year-to-date hindering inventory reduction. New Jersey's rate has been improving but still lags the national average and the state is still seeing an influx of new inventory. Florida on the other hand reduced its inventory by 30 percent through August of this year.
The result of these huge inventories is that a loan remains in limbo for years. In Florida the average mortgage in its inventory has been delinquent for 3.5 years; in New York it is 4.6 years and in New Jersey 4.1 years. The average across all other states is 800 days of delinquency or 2.2 years.
New York and New Jersey, as well as Massachusetts and Hawaii still have inventories at five times pre-crisis level. Only six states (Utah, Michigan, Colorado, Montana, Indiana and Ohio) have reached pre-crisis levels of foreclosure inventory
Finally, the Monitor looks at cash out refinances in the second quarter of 2016 which tapped 22.6 billion in equity from US homes, the largest sum since the second quarter of 2009. Even so, the dollar volume was nearly 80 percent lower than at the peak of cash-out refinancing in the third quarter of 2005.
Seventy-three percent of refinancing was of mortgages originated in 2009 or later and the average credit score of cash-out borrowers was 748, nearly 60 points higher than the average in 2005-2007. Further increasing the credit profile of refinance loans during the quarter, 40 percent of rate/term refinances involved borrowers reducing the term of their loan.
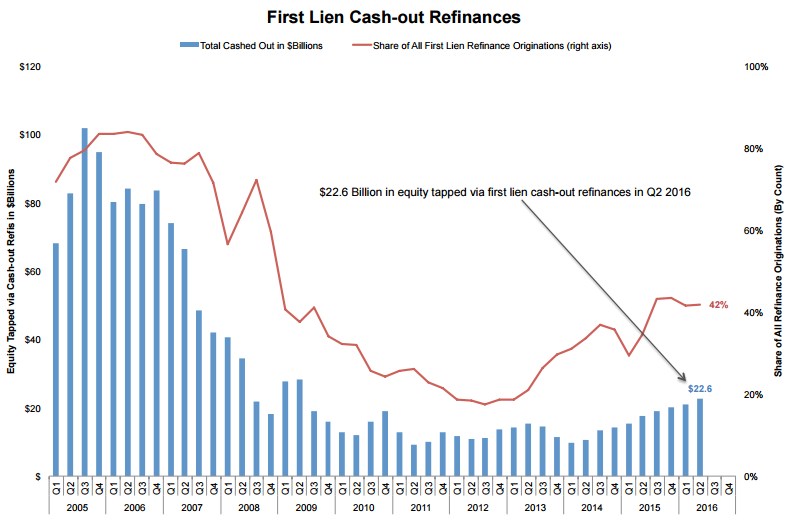
Black Knight Data & Analytics Executive Vice President Ben Graboske said, "The roughly 350,000 cash-out refinances in Q2 2016 accounted for 42 percent of all refinances in the quarter, and marked the ninth consecutive quarterly increase in cash-out lending, not only by count, but also by the amount of equity tapped," said Graboske. "At $22.6 billion, that works out to approximately $65,000 in equity tapped per borrower. While that per-borrower number is slightly down from Q1 2016 - but $6,000 higher than one year ago - the $22.6 billion total is the largest equity sum tapped since Q2 2009. Just to put that into perspective, though, it's still a nearly 80 percent lower equity draw than at the peak in Q3 2005. And, given that we saw over $550 billion in tappable equity growth last year alone, this equates to borrowers only tapping into 15 percent of the growth in equity over the past 12 months, without even touching the $4.5 trillion balance in tappable equity available. All in all, it's clear that cash-outs are helping to prop up the refinance market - their 42 percent share is up from only 30 percent in early 2015 when interest rates had also dropped. What's more, refi volumes are down from 2015 - at least through the second quarter - but while overall they're down nine percent from Q1 2015, rate/term refinances are actually down 25 percent over that same period.


